Water Quality Data Analysis - Rainfall and Bacteria Introduction
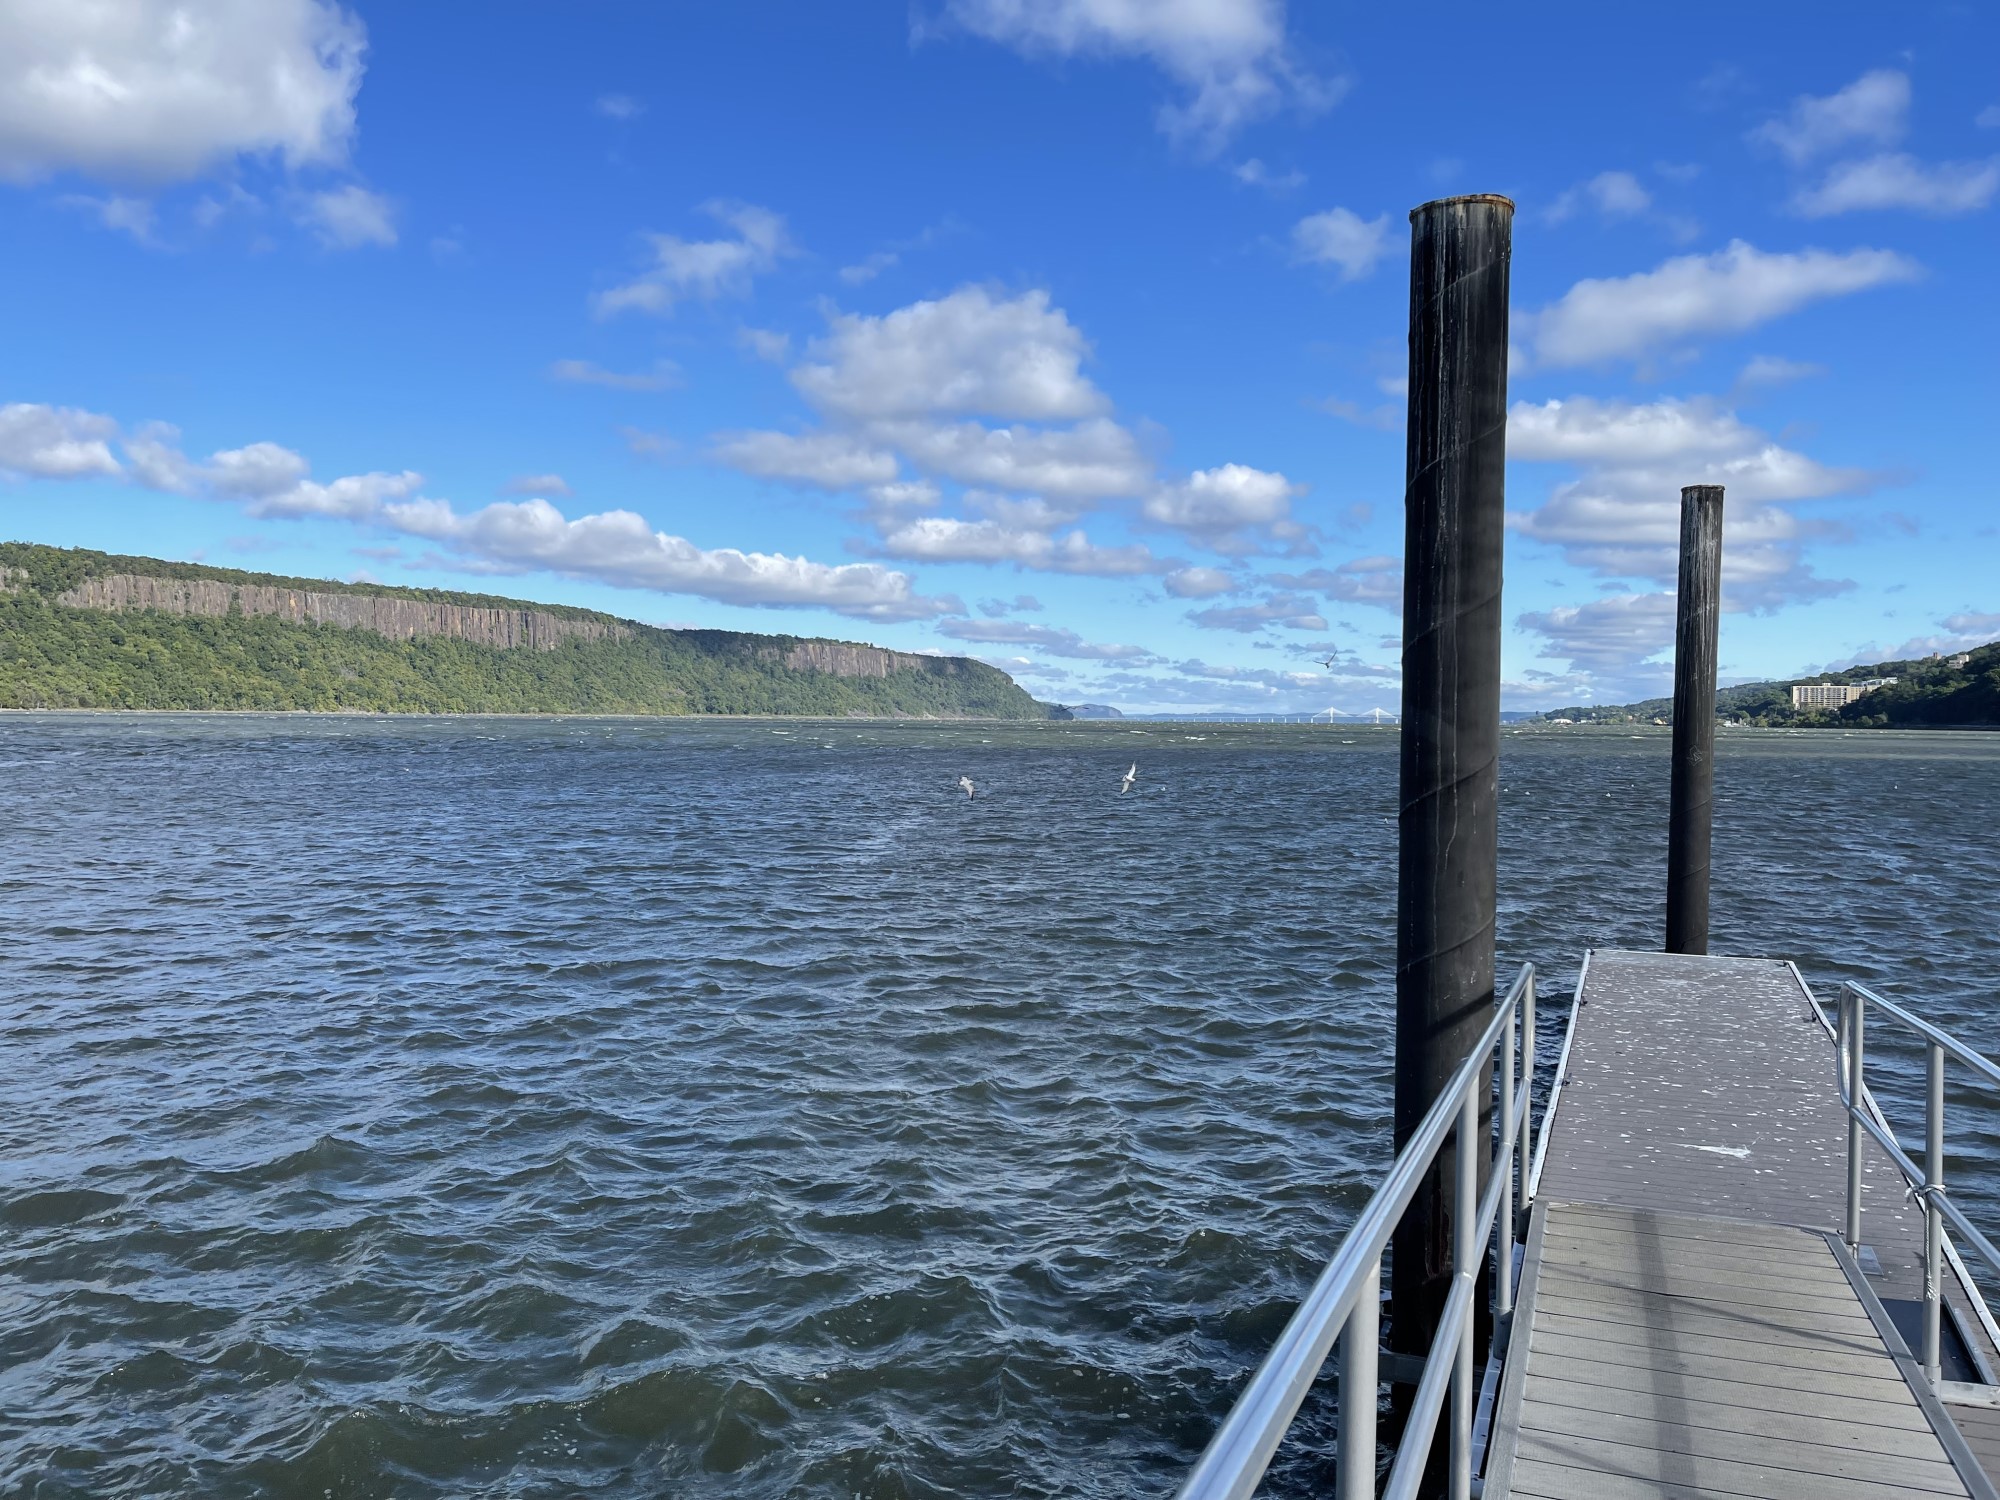
Pictured above - the JFK Marina sampling site (photo by Diane McKay)
The Sarah Lawrence College Center for the Urban River lab at Beczak (SLC CURB) hosted fecal indicator bacteria sampling from the Hudson, Saw Mill, Pocantico and Bronx Rivers throughout the 2022 sampling season of May through October. A common statement made by volunteers across all of the sampled watersheds (excluding the mighty Hudson) was “the river was very low”. The total rainfall for the city of Yonkers, home of SLC CURB, in the summer months of June, July and August was a combined 7.28 total inches. Compared to the same period of time in 2021 that reported a combined 19.75 total inches of rain for the three month period. We examine here how rainstorms (or their lack of) and imperfect infrastructure* systems combined cause introduction of bacteria to our waterways.
When we think about sewage infrastructure within the Saw Mill River watershed/sewershed - we know there are miles of both locally owned pipes and the county owned trunk lines that use the force of gravity to transport municipal wastewater to the Yonkers Joint Wastewater Treatment Plant. These pipes are not visible to us as we walk sidewalks of our neighborhoods and drive along the parkways; but they are there - right below us. There are very few opportunities to determine if these pipes are in need of repair or if they are holding up to the test of time and local environmental conditions.
What we have seen in our historic data is a spike of fecal indicator bacteria in the Saw Mill River when greater than an inch of rain has fallen within 24 hours of sampling. This supports the hypothesis that rain is a core factor in the transport of bacteria into our local environment - above and below ground. Even in the comparison of 2021 and 2022 where less than half of the amount of rain occurred than the year prior - fifteen samples exceeded the limiting maximum of the IDEXX test of a result >24,196 vs. six samples within the same area range in 2022. We can hypothesize based on the comparator of these two years, that rain (and the amount of it during a period of time) is a transporter of bacteria from its source to our waterways.
In conclusion, when designing a human centered world - nature and its force must always be a predominant consideration.
|
2021 |
2022 |
|
|
Rainfall June, July, and August |
19.75” |
7.28” |
|
Percentage of Acceptable MPN of all sites EPA Threshold 60 MPN |
7.14% 7 samples |
11.8% 12 samples |
|
Wet Weather Event within 24 Hours of Sampling > 0.5” |
1 |
2 |
|
Most amount of rain in 24 Hour period from sampling |
8/19/21 Rainfall: 0.81” |
6/9/22 Rainfall: 3.23” |
* Infrastructure: the basic physical and organizational structures/facilities that are needed for the operation of society
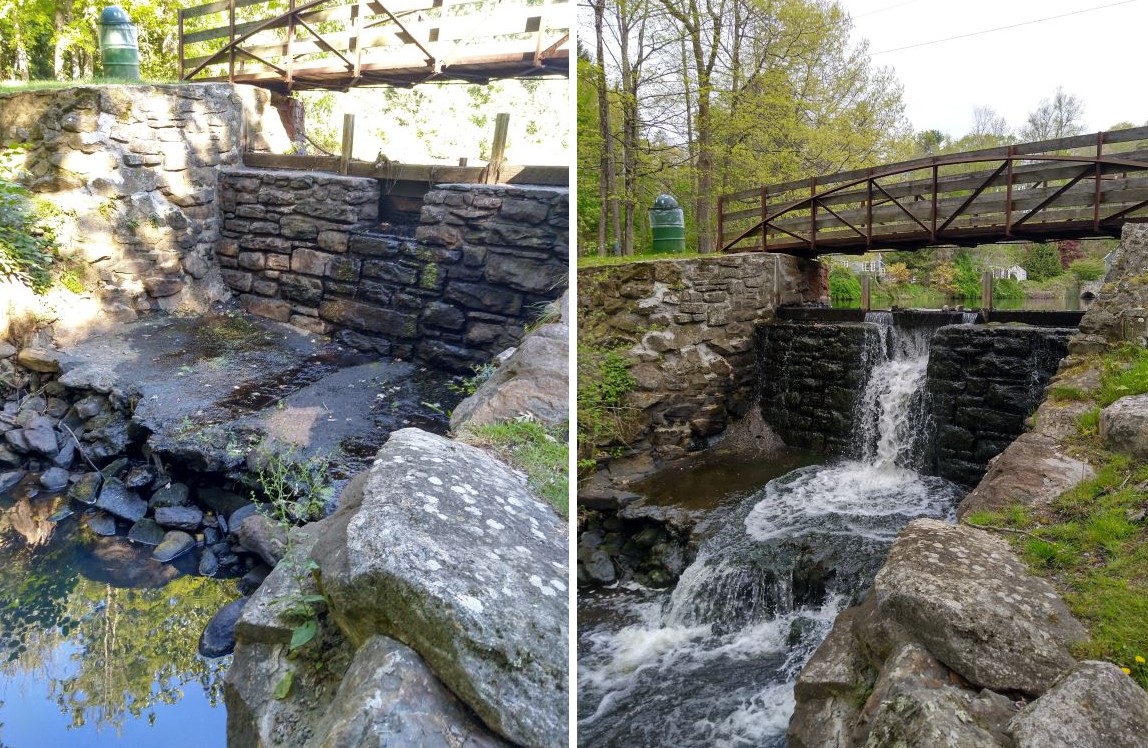
Seen here: the visual contrast of Duck Pond Spillway in Chappaqua sampled by Helen M. and Sharon A. - (Left) June 23, 2022; (Right) September 1, 2022.
The program is funded in part by ConEdison and is part of the Lower Hudson Urban Waters Collaborative which includes SLC CURB, Riverkeeper, and Bronx River Alliance.