A Look Back at the Data: July Historical Seining Results
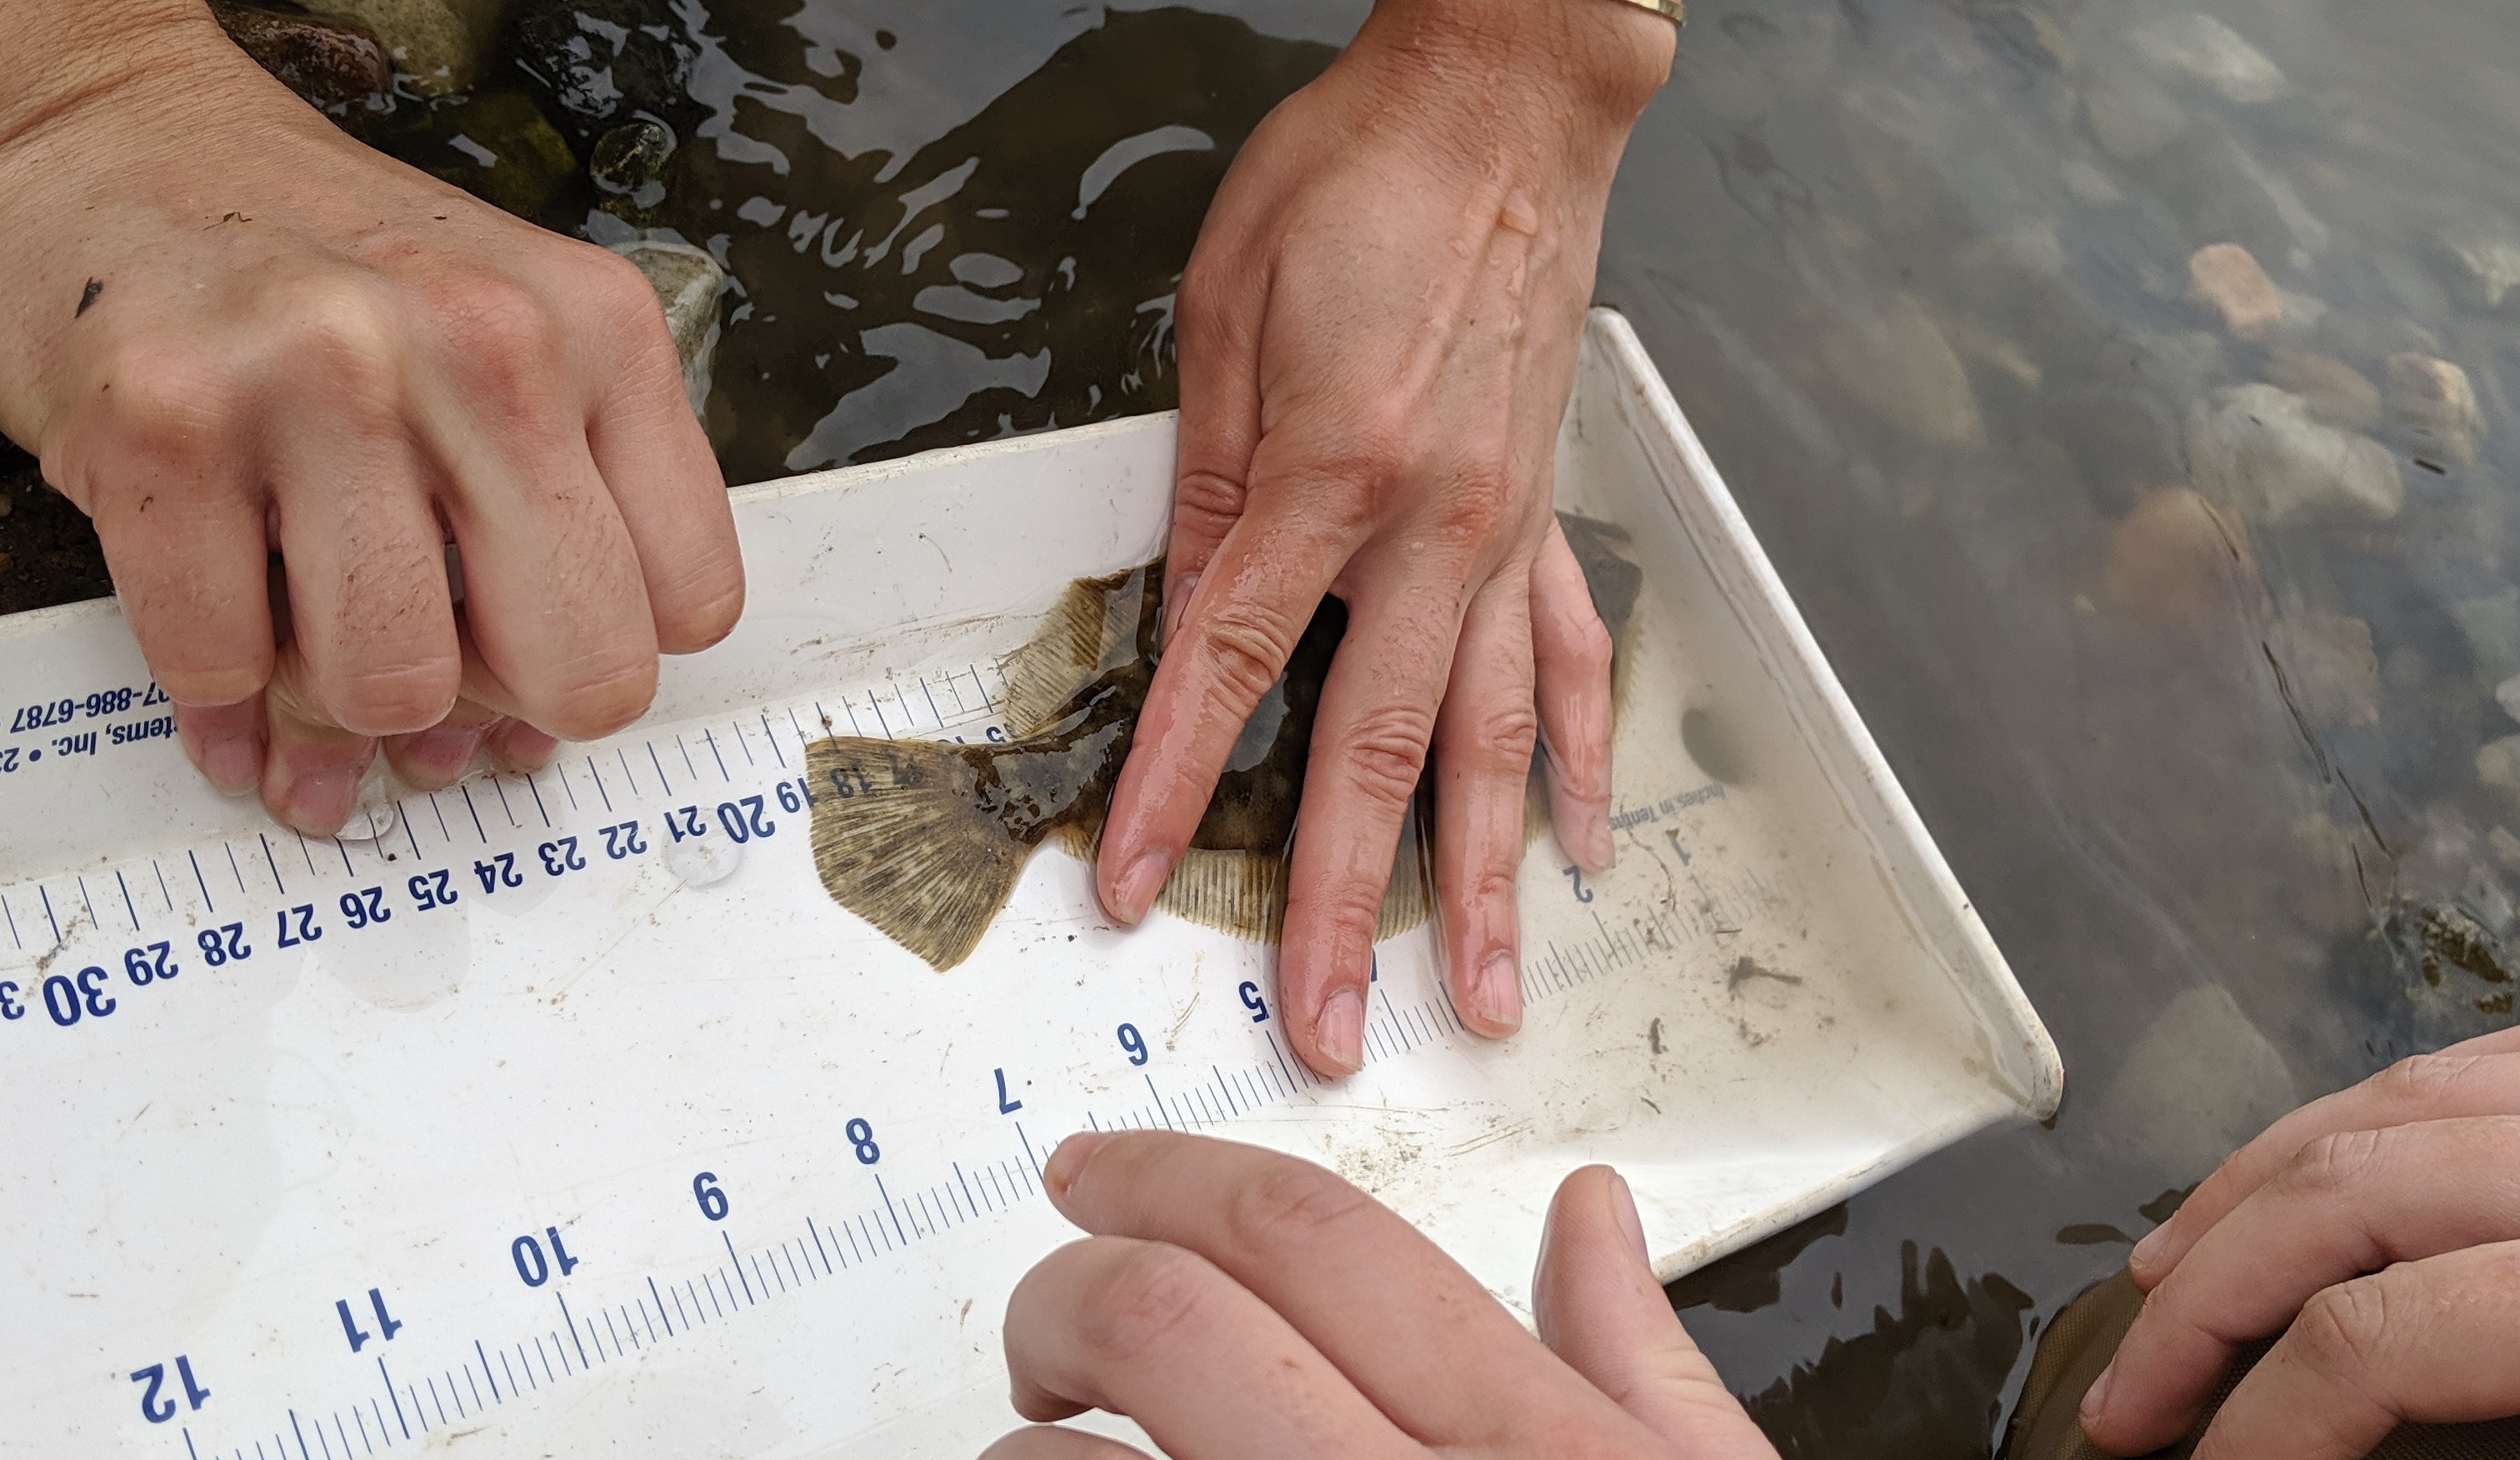
Pictured above - A flounder being measured after one of our seining programs.
As CURB’s seining season continues to be on hold due to the COVID-19 pandemic, we take our monthly look back at our historical seining data. This summary will be focused on July data that was collected from 2005 – 2019.
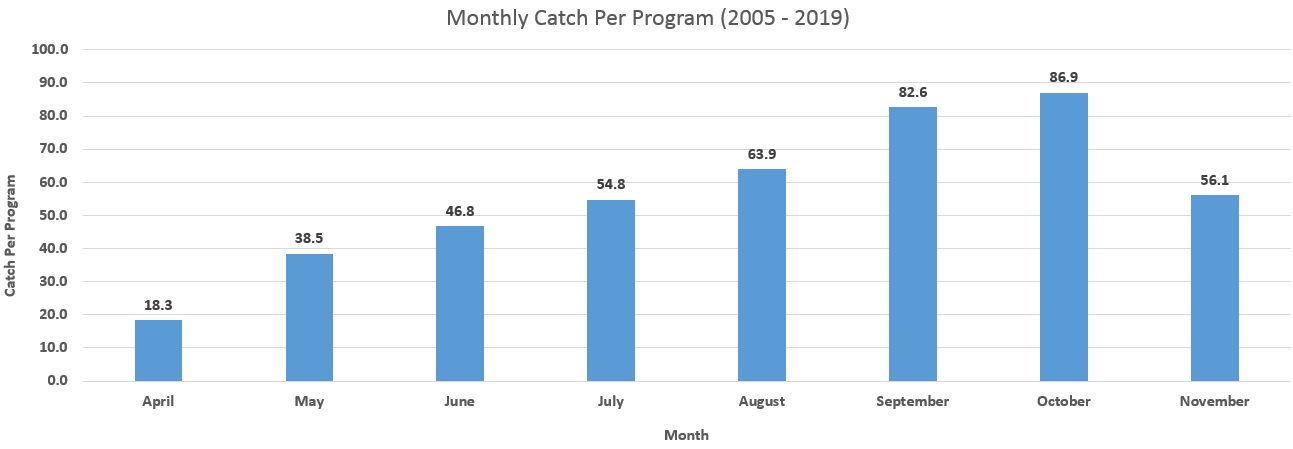
Previously we looked at our spring seining data, which tends to be the least productive part of our April – November season. As we move into July, our catch totals really begin to take off. You can clearly see this in our monthly catch per program chart below. At the same time, water temperatures are usually well into the 70’s and even 80’s by July, which also plays a role in the increased catches.
So what do we typically catch during the month of July? Our top 3 catches are moon jellies*, Atlantic silversides, and shrimp (grass and sand). I’m going to say more about the moon jellies in a bit. Other catches with high totals include striped bass, blue crabs, and mummichogs.
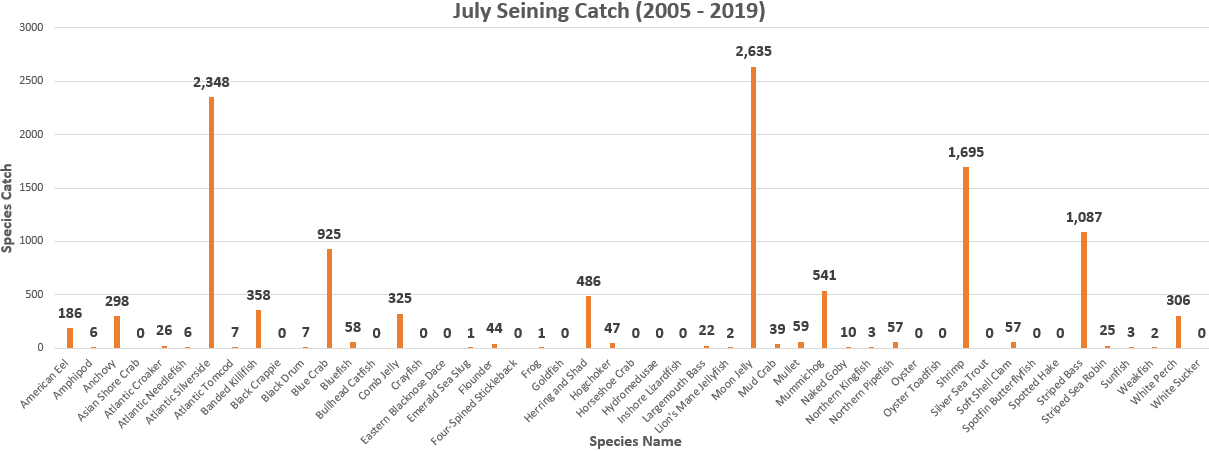
Now let’s get back to the moon jellies. With 2,635 caught during our 15 years of July data, they are the most abundant catch during this timeframe. However just looking at this total number would be a bit misleading. So let’s take a deeper dive into the data. In many years we averaged just a handful of moon jellies during the month of July. So why was our total so high?
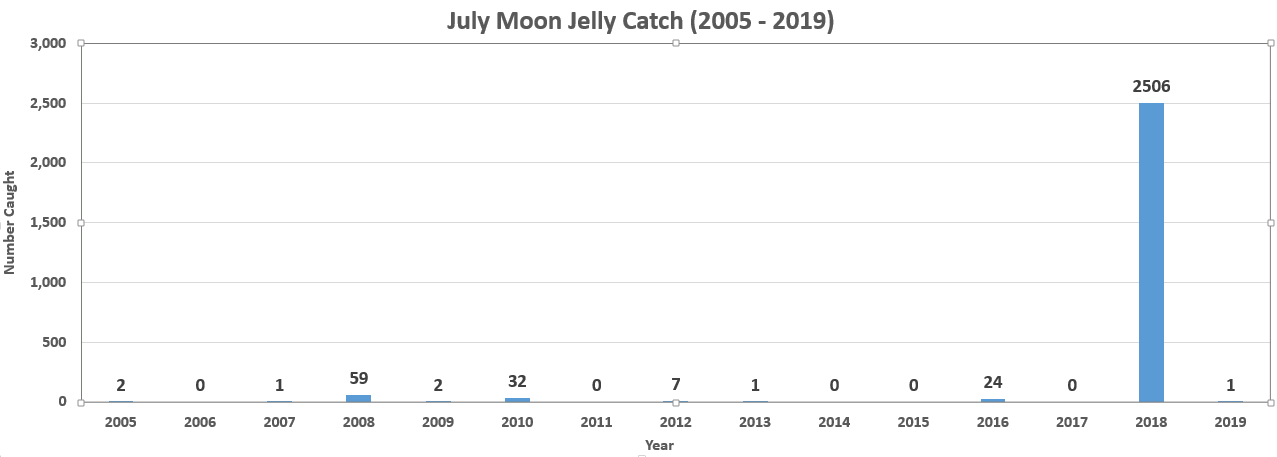
Mostly because of July 2018 when we caught 2506 moon jellies! If you subtract that year, we caught a total of 129 moon jellies over the other 14 years combined, for a yearly average of just over 9. Moon jellies are a common catch for our location, but we usually see higher numbers of them in the late summer to early fall. In 2018, they made their way into our waters much earlier in the season, and in very high numbers. June and the first half of July 2018 saw an extended stretch of dry weather, which allowed the salinity in Yonkers to peak near 15ppt. This increase in salt may have played a role in the higher number of moon jellies. We also saw increases in other salt tolerant species during this timeframe.
Moving back to the rest of our data, let’s take a look at some of the animals that are caught predominantly in July.
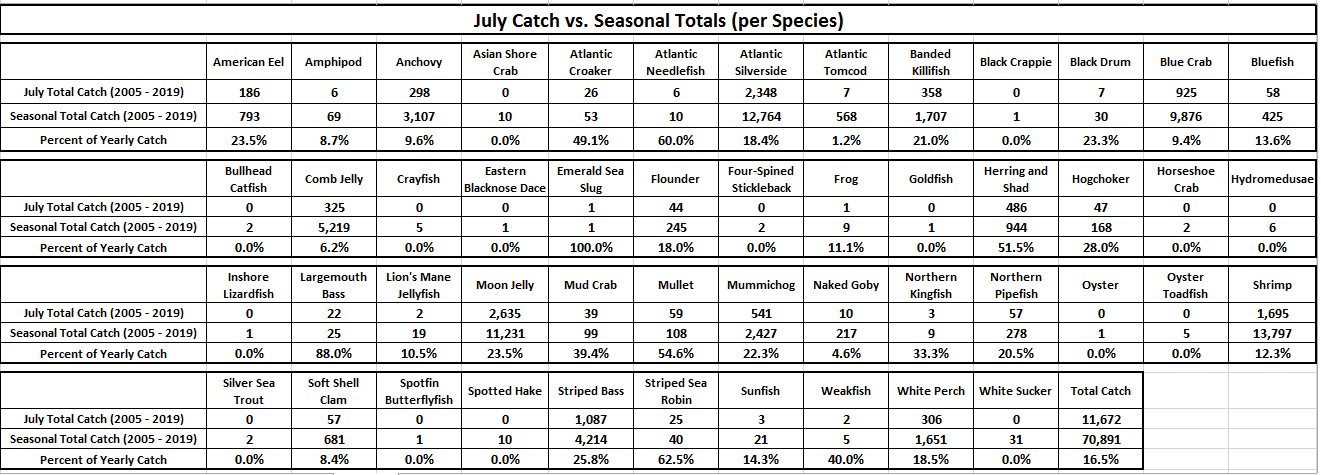
Here are several which stand out (minimum of 20 caught): largemouth bass 88% caught in July, striped sea robin 62.5%, mullet 54.6%, herring and shad 51.5%, and Atlantic croaker 49.1%.
Lastly, let’s take a look at the trends in our July catches over the last 15 years. The table below shows the catch total for July during each year, along with the catch per program average during these months.
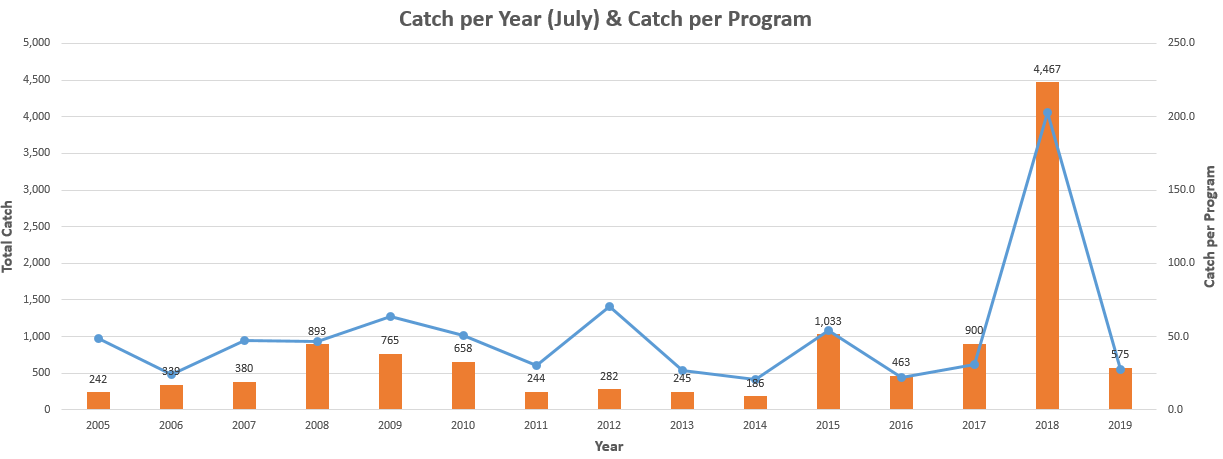
These numbers vary quite a bit from year to year, and we would really need to take a closer look at the environmental conditions to see why certain years stand out from others. Of course 2018 towers above the rest thanks in part to the very high moon jelly counts. But otherwise there hasn’t been much of a trend towards higher or lower counts during July over the 15 years.
For a full look at the data, please check out the seining page of our website.