June and July Seining Results
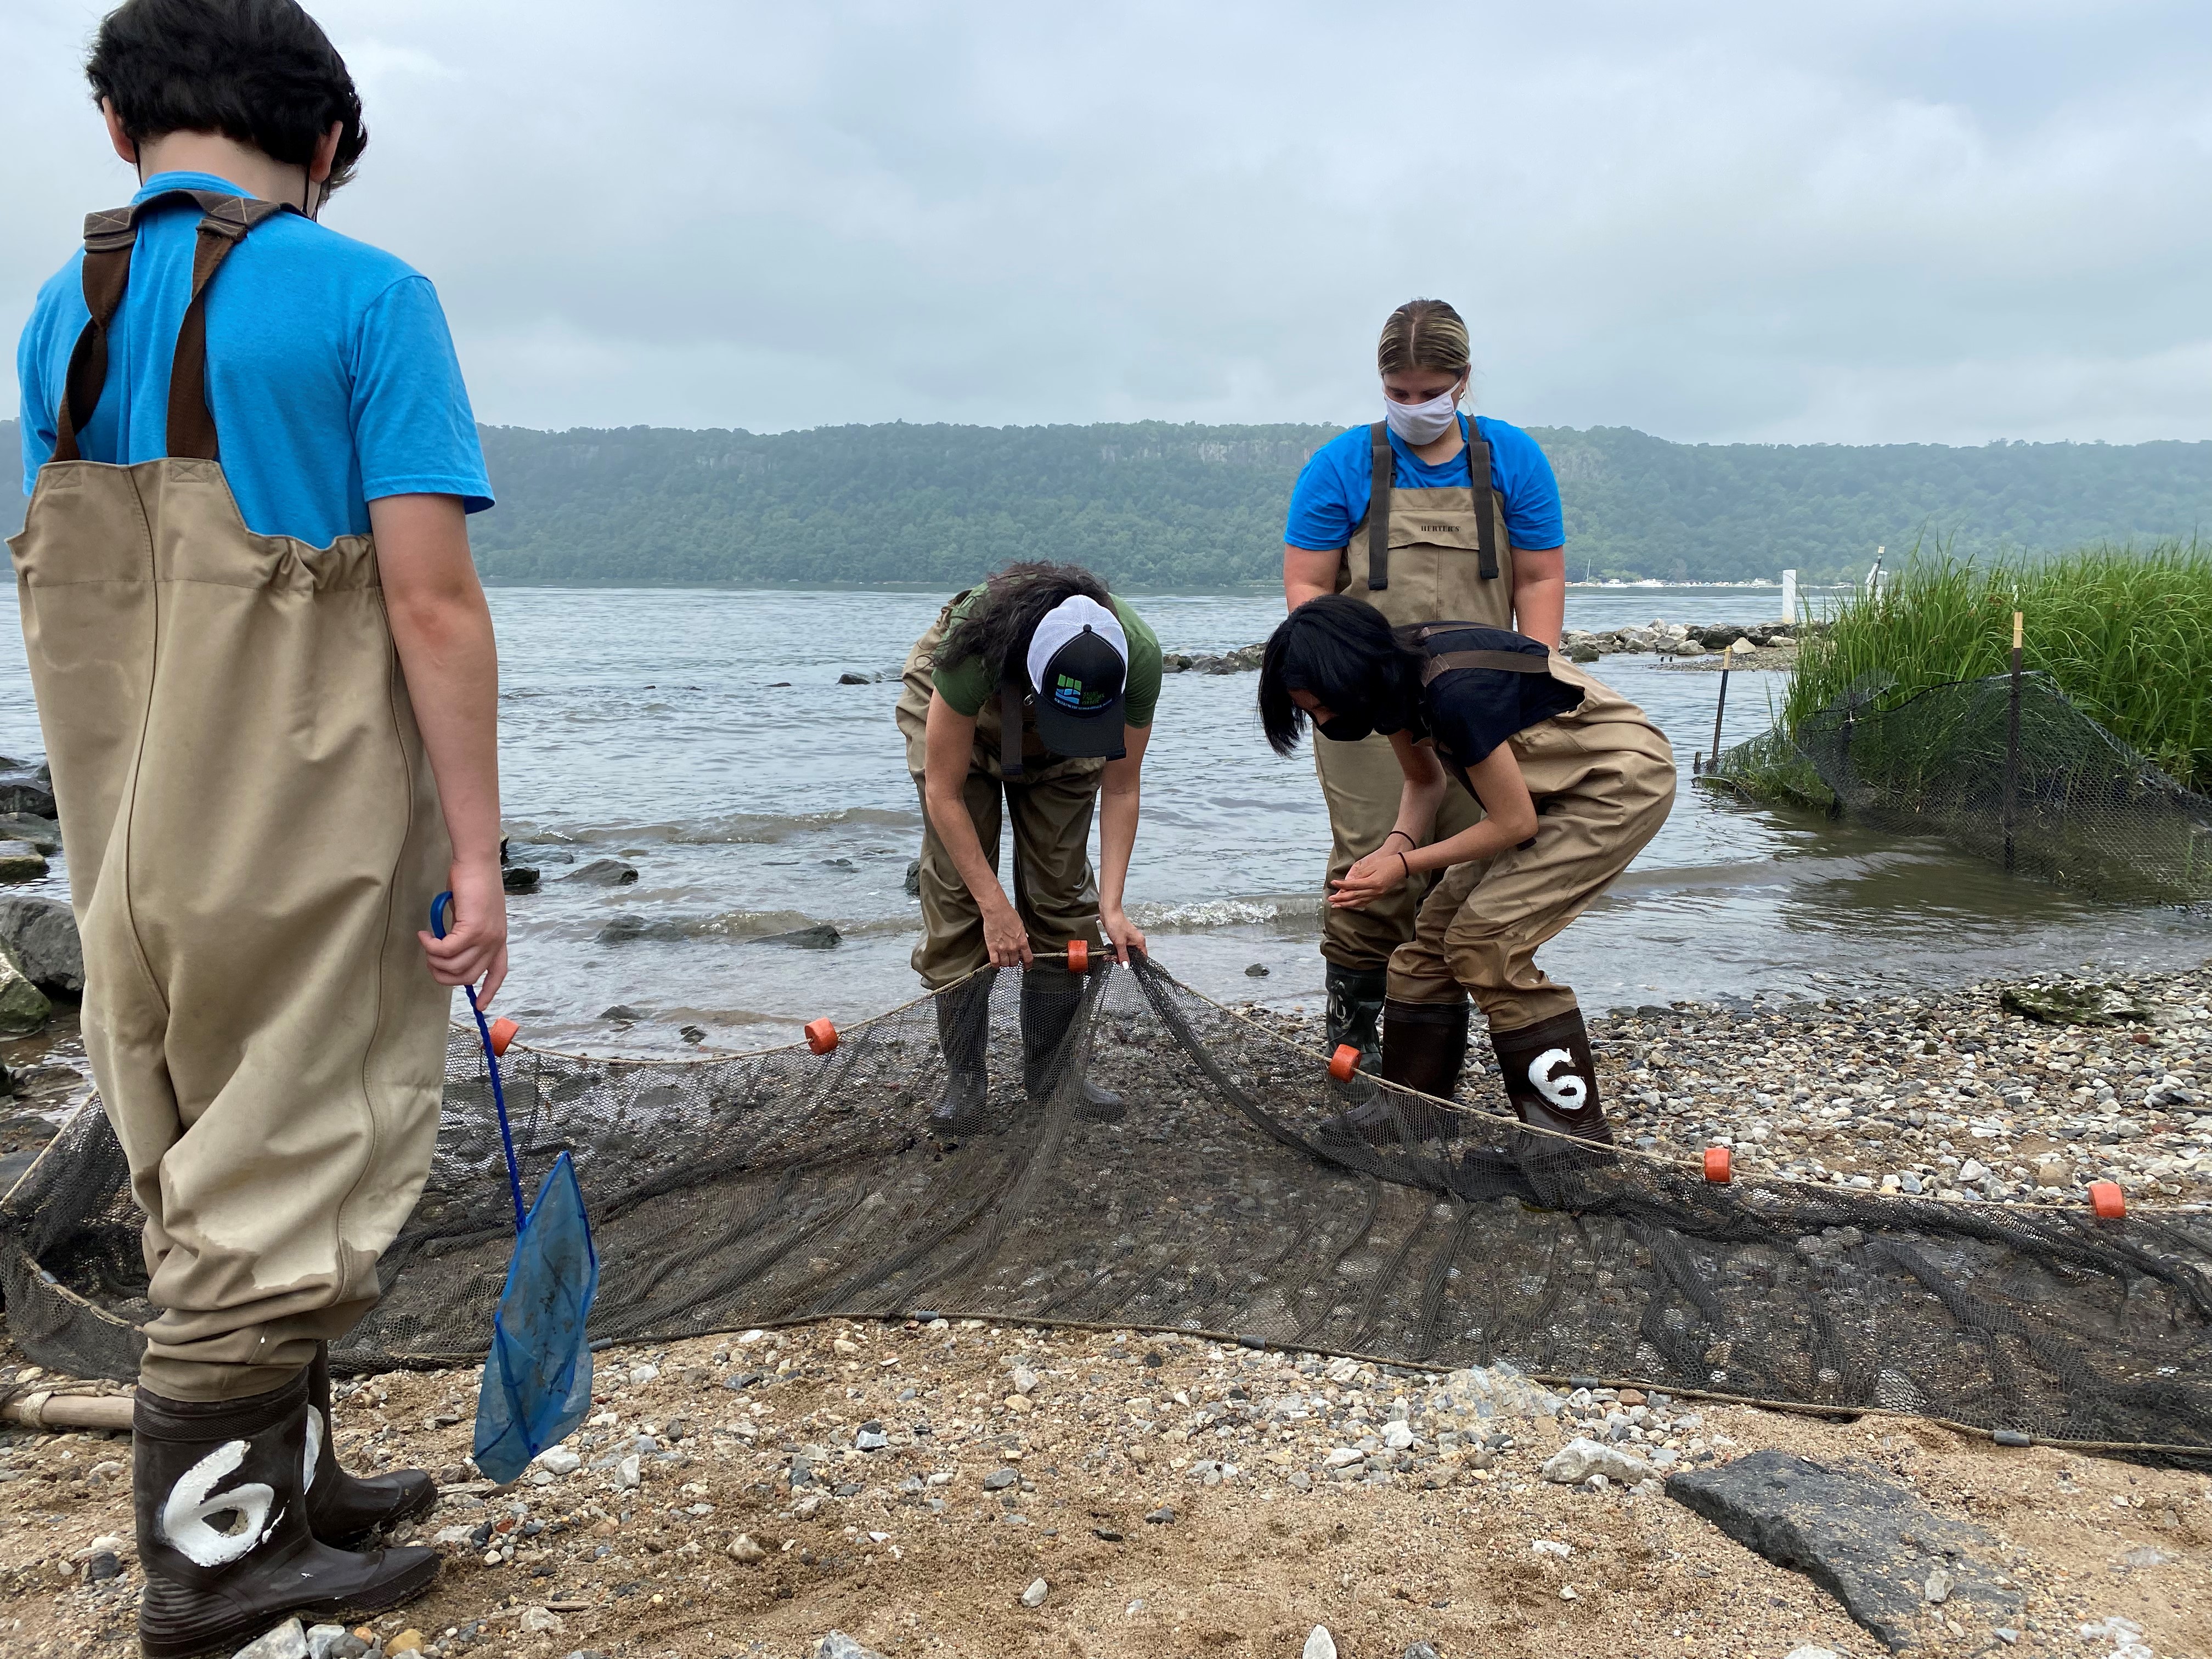
After a relatively slow start to our seining season, things really picked up towards the end of May and into June. This was around the same time that water temperatures soared from the mid 60’s well into the 70’s. In all, our total catch for June was 658. Our top 3 catches included 452 shrimp (grass and sand), 89 blue crabs, and 41 moon jellies. Shrimp and crabs made up 82% of the catch for the month.
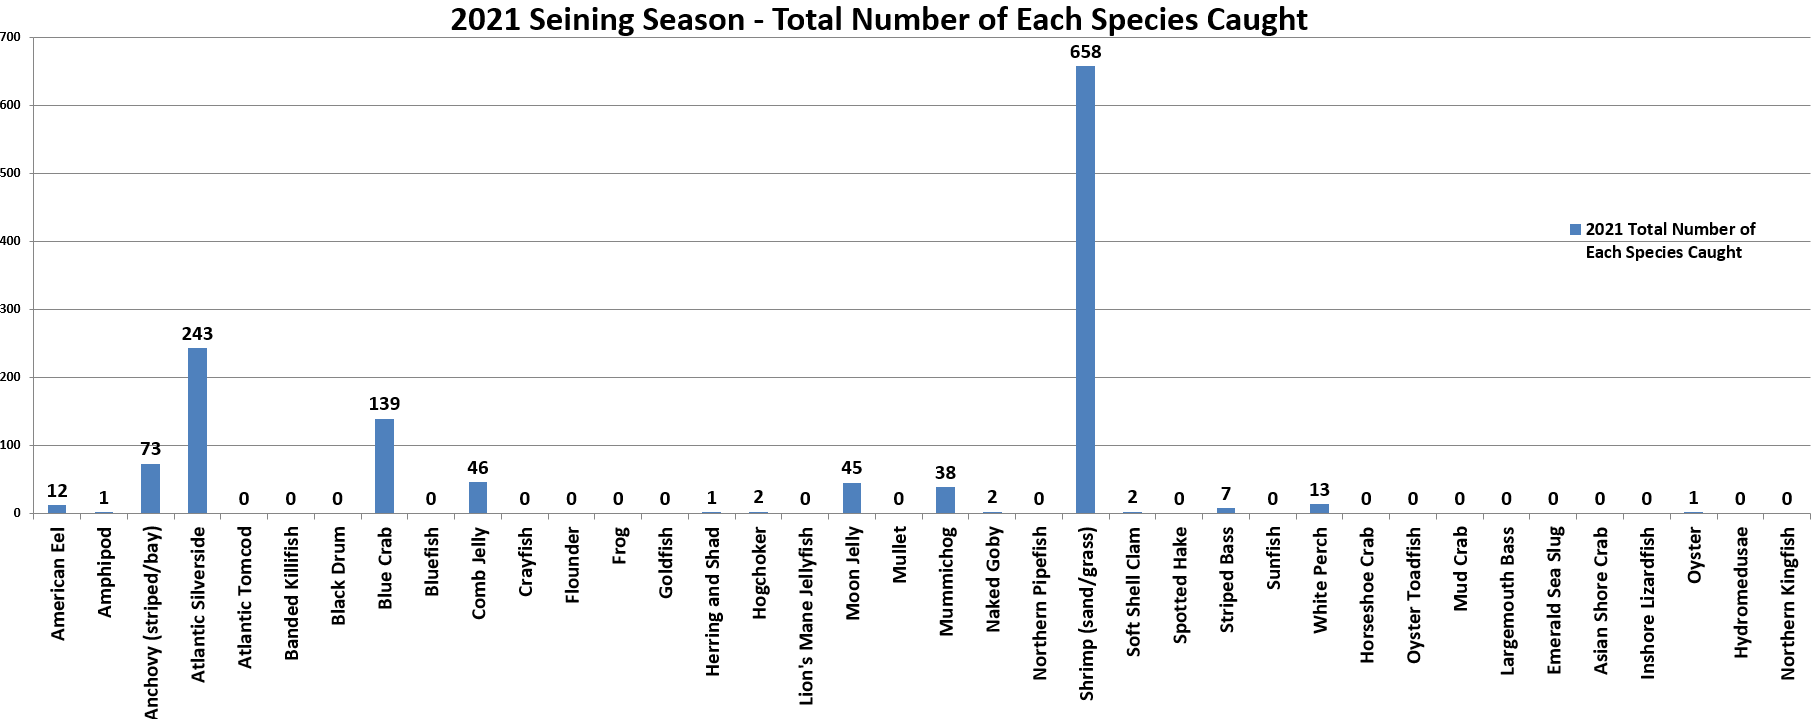
Our total catch for July dropped a bit, down to 387. Our top 3 catches included 238 Atlantic silversides, 70 shrimp, and 28 blue crabs. Atlantic silversides made up 61.5% of July’s catch. What is notable is the big drop in shrimp and crabs. One possible reason for this is that many of our seines during July occurred at mid to high tide, which makes it difficult to get the net far enough out to the muddy substrate where many of these crustaceans live. This is also likely why our overall count was down for the month. Another thing to note is the increase in Atlantic silversides, from just 1 in June to 238 in July. We often see this schooling fish in increased numbers as the water warms into the 70’s and 80’s. So it’s not surprising that there was a big jump in their totals.
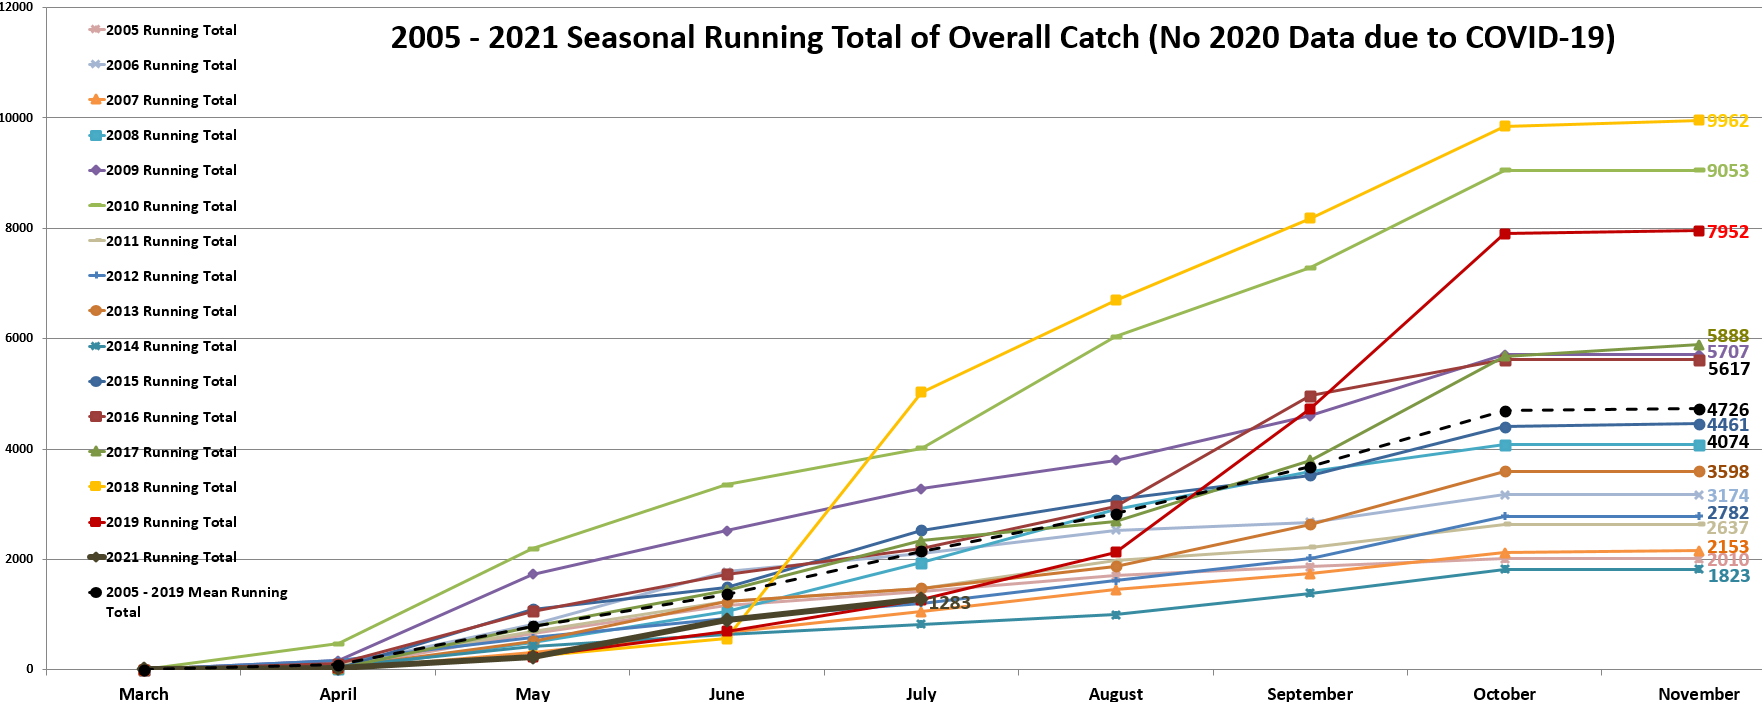
In terms of the season as a whole, we’re at the lower range of our historical totals for this point in the season. Our average count by the end of July (2005 – 2019) is 2,144. We’re at 1,283 this season. This doesn’t necessarily mean that the 2021 season will finish near the bottom of the pack. We have had several seasons that started out slowly only to finish with big catches in the fall.
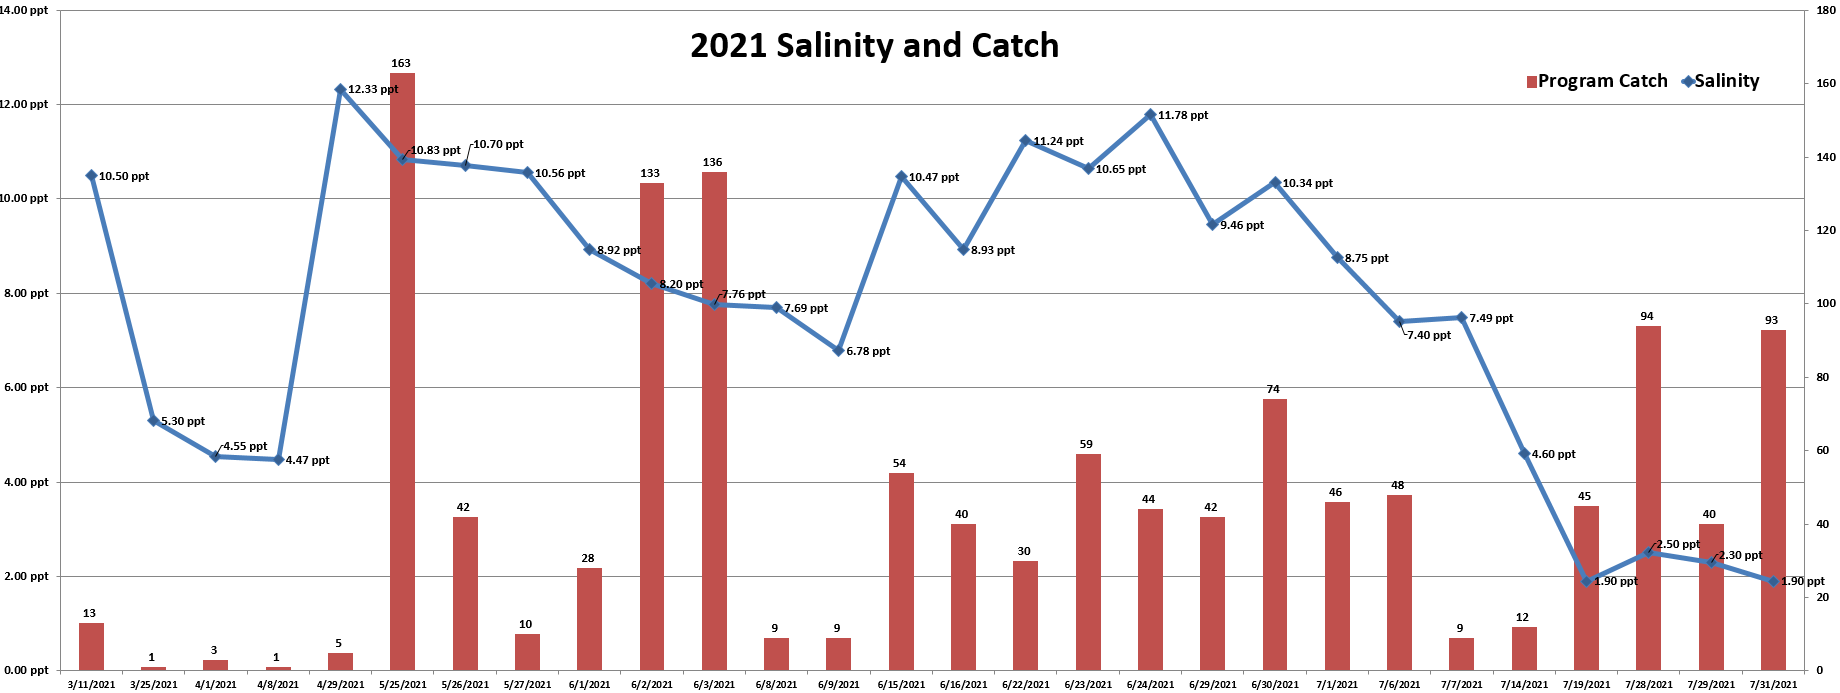
There have been a few environmental factors over the last month that could be affecting our catches. We saw a very noticeable drop in the salinity (measurement of salt in the water) from a high of 12 ppt at the end of June to 2 ppt at the end of July. Excessive rainfall and runoff caused the salt front in the Hudson to move south. During typical summer conditions we see salinity readings around 10 - 15 ppt in Yonkers. In addition to the changes in salinity, the dissolved oxygen levels were on the low side, hovering around 6 ppm for much of June and July. These levels are borderline for many fish species in the area, and could have had an impact on our catches.
Follow the data with us at:
https://www.centerfortheurbanriver.org/research/seining.html