Saw Mill River and Hudson River Stakeholder Review of 2023

by Educator & Science Coordinator Katie Lamboy
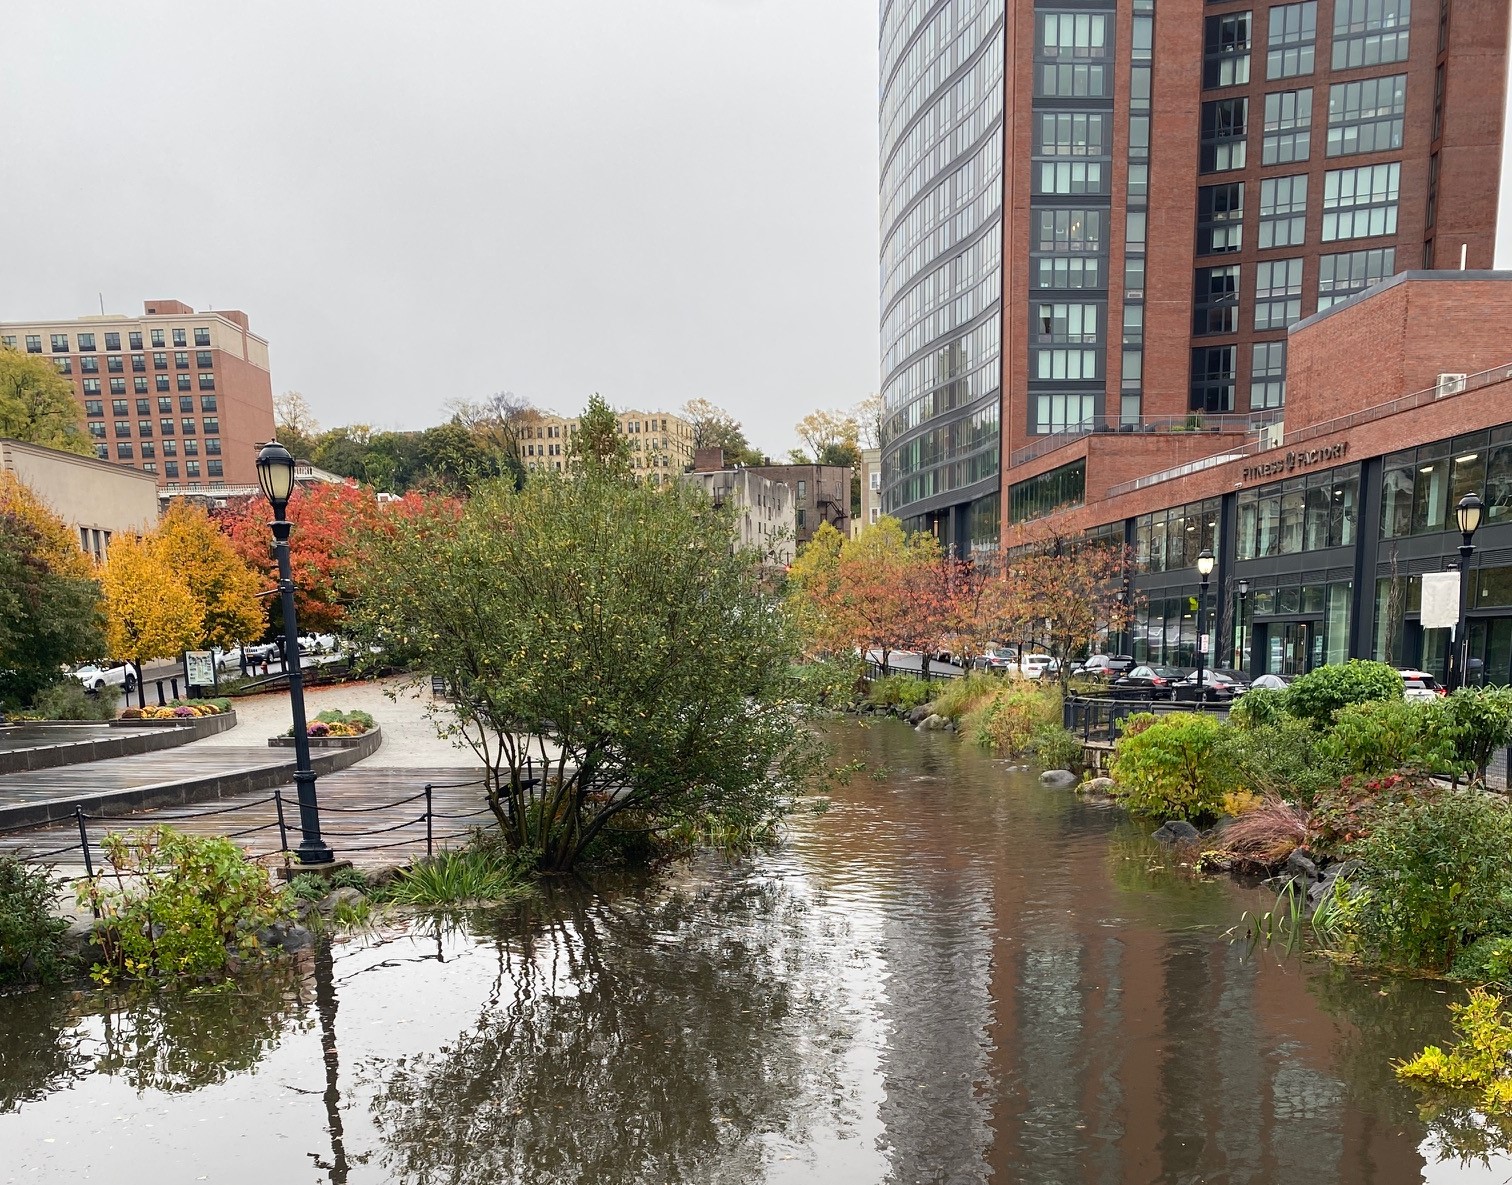
Flooding is fairly synonymous when thinking about the Saw Mill River and I mention rain a lot when speaking about this bacterial sampling program and its connection to water quality. This is not coincidental. We know that rain has some form of impact when thinking about urban environments. Whether on the surface through the process of runoff or the intricacies of Inflow & Infiltration (also referred to as I & I), precipitation does not actively seek out the path to less environmental impact. Rain is part of our earth’s systems and we must workaround it.
Generally, when we look at years with a dryer sampling season, we can see “better” water quality. I say “better” here because this is comparative to the data collected historically - not against the EPA public safety standards (a geometric mean of 30 cfu/100 mL for a long term data set). In 2022, around 15% of the total samples were collected during rain events*. This resulted in 73% of of Saw Mill River sites showing lower than the historic geometric mean. In 2023, around 46% of the total samples were collected during rain events*. This resulted in 40% of Saw Mill River sites showing lower than the historic mean. Although this is not a stark comparison, we are able to determine hot spot sites that have elevated bacterial levels independently of the impacts of rain on the ailing infrastructure.
Notably, most of the same hot spots remain on the watch list; but, more shocking than this is that not one of the Saw Mill River sites calculated a season geometric mean lower than 200 MPN. This is almost 7 times the highest recommended for current water quality criteria for ambient waters. And although the Saw Mill River is not a swimming river, we know that there are all walks of life interacting with this water and deserve to be safe while doing so.
Please click here for the complete data report.