2024 Eel Migration Season Concludes with a Record Count at CURB
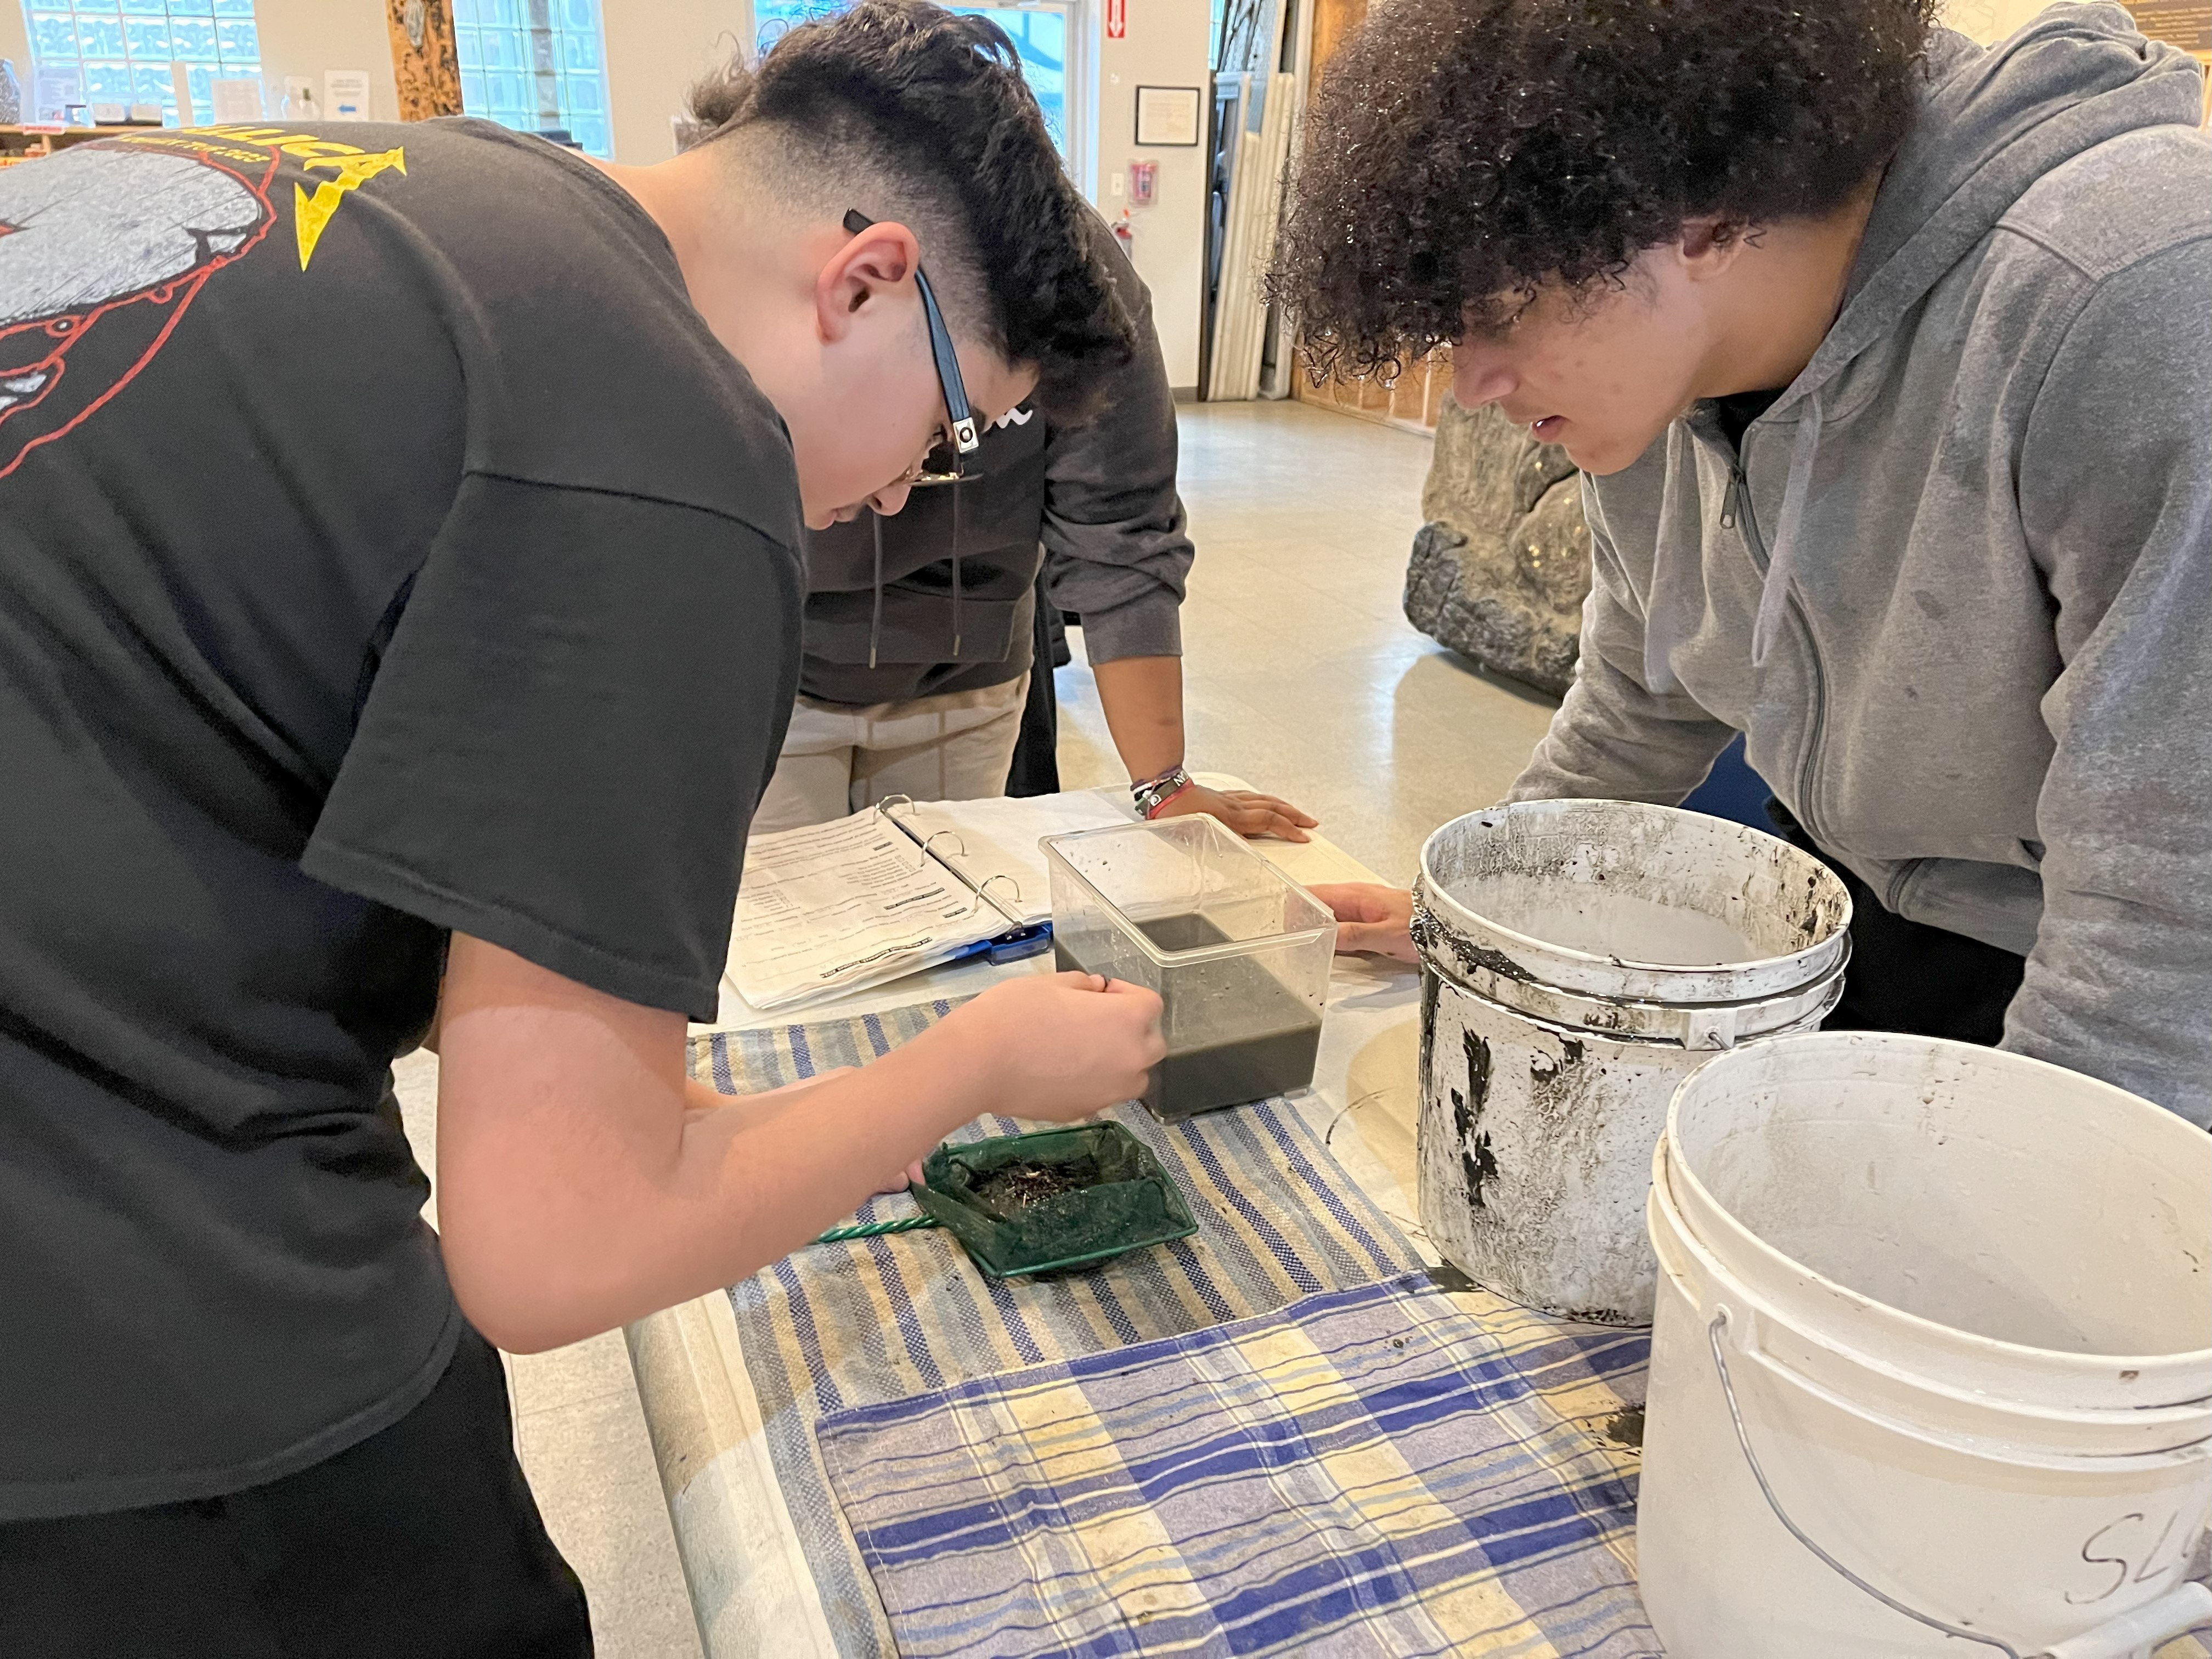
CURB’s team of staff and volunteers recently wrapped up a record-breaking eel migration season in Yonkers. Our season began on 1/26 and continued for a total of 18 weeks, with the fyke net being removed on 5/23. This marked the end of our longest season ever, with 83 days of sampling. Here are some of the highlights of what was a remarkable season:
- 5,777 glass eels were caught in total, which topped our previous record of 3,571 in 2022. Our seasonal average is 2,001 glass eels. This was our 11th year of sampling with the fyke net.
- We had 18 days with at least 100 eels caught. Our seasonal average is around 6.
- We caught our first eel on 1/31, which was our earliest catch ever. We sampled for 18 weeks this year, also our longest season.
- We caught at least one eel during every day of sampling from 2/8 – 5/21, which is the longest such stretch.
- We set monthly records for January (1 eel, prev. 0), March (2,906 eels, prev. 2,193), and April (2,143 eels, prev. 1,297).
- Over our first 5 years of sampling (2014 – 2018) we averaged 763 glass eels per season. Since then our average has been 3,238 per season.
- We had 477 non-American eel catches in the fyke net made up of 14 species. This included first-time catches of speckled worm eel larvae and a tessellated darter.
Here are a selection of tables and graphs from the 2024 sampling season:
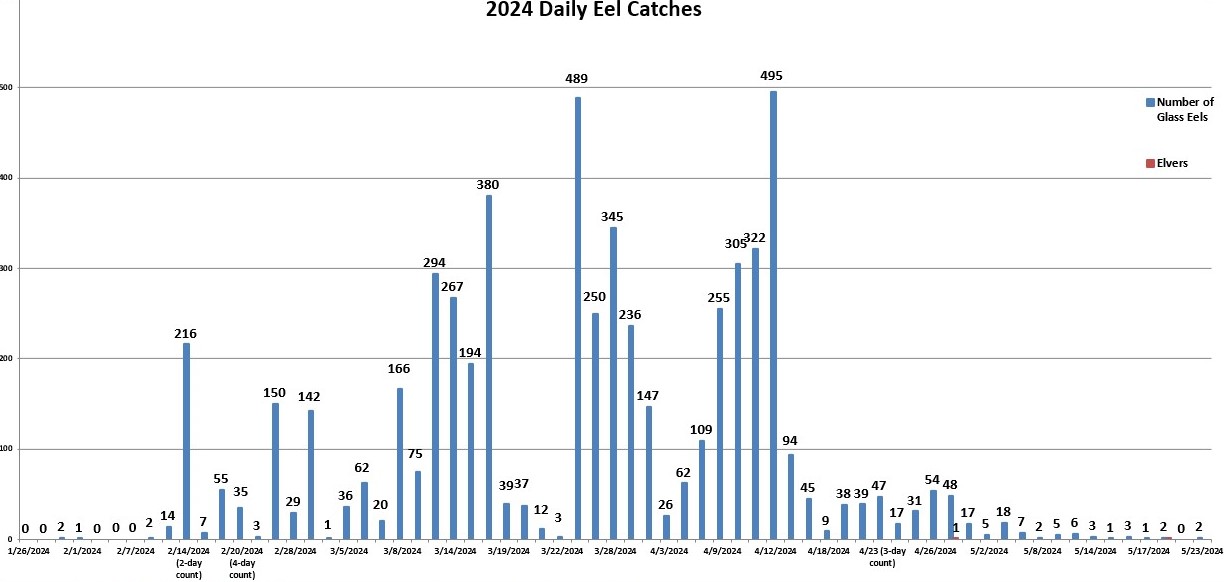
Our daily eel catches with the peak of the season from mid-February though mid-April.
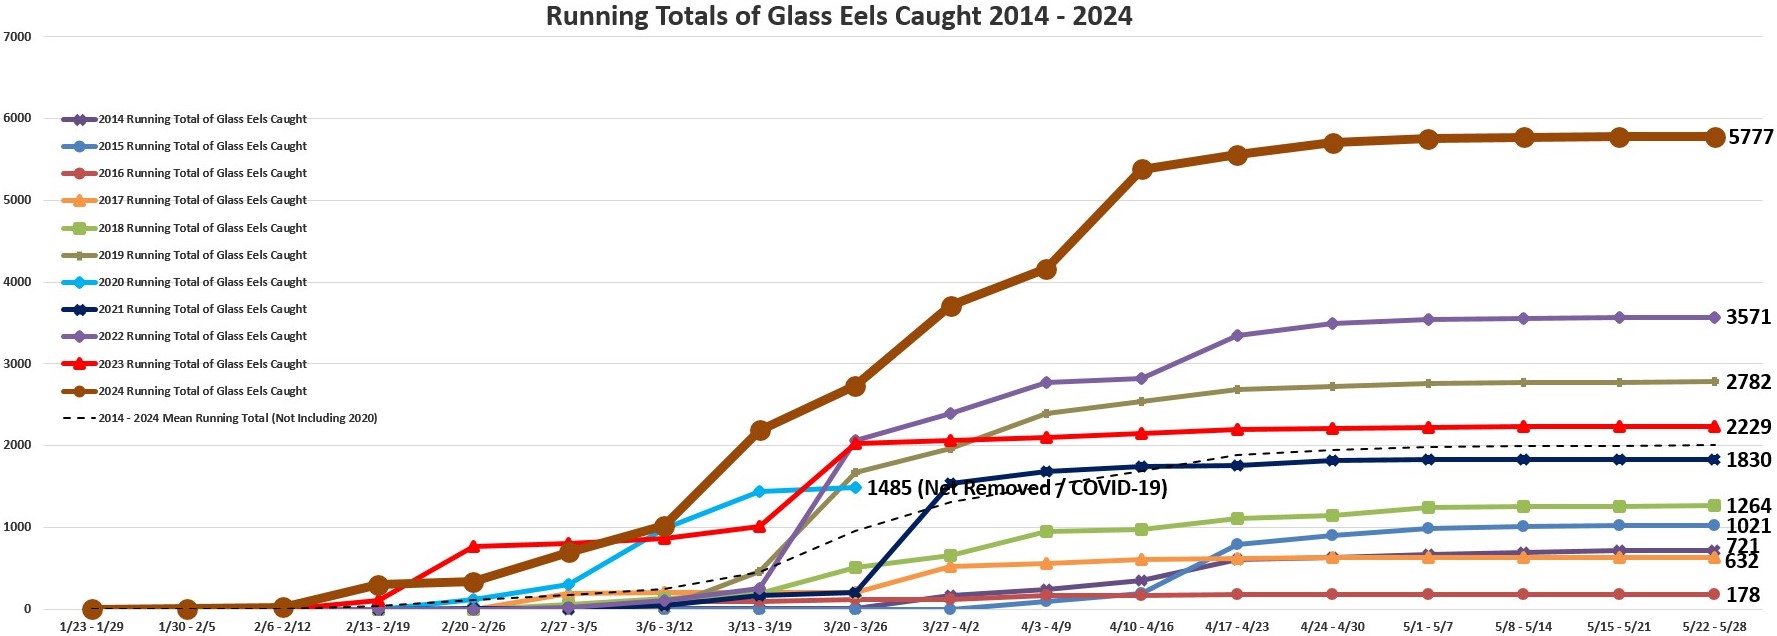
Our seasonal catches from 2014 - 2024, with the 2024 season in brown.
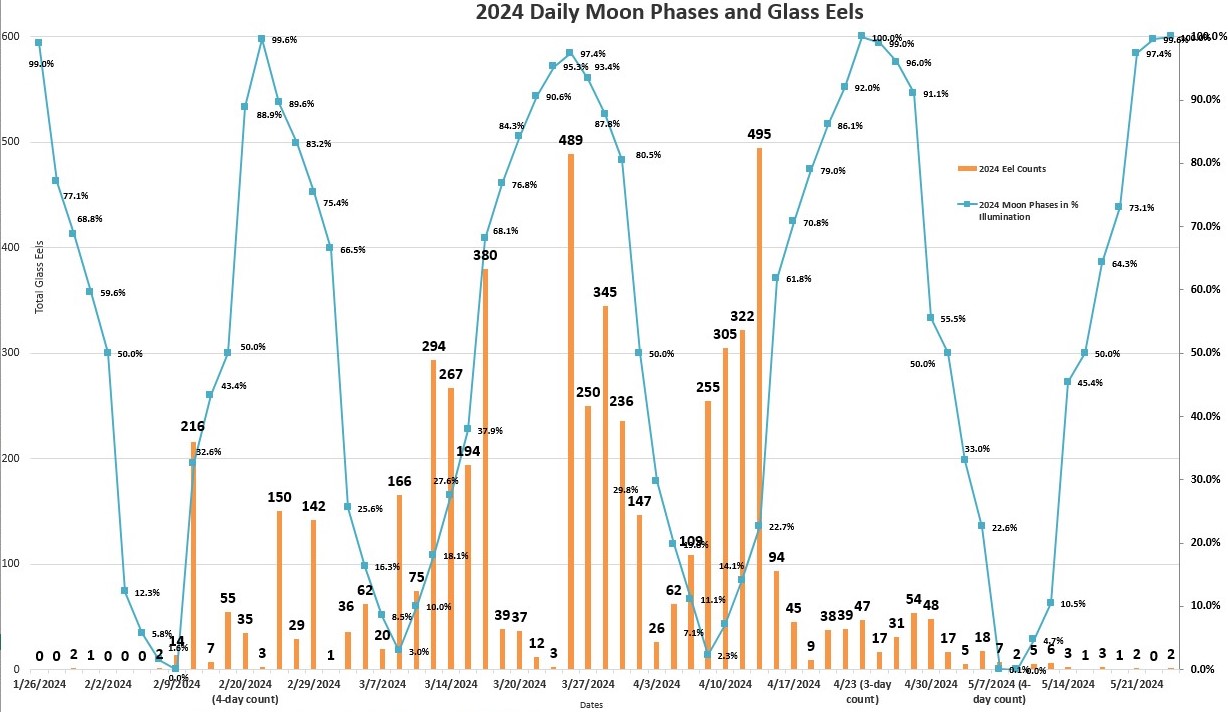
Daily eel catches and moon phases showing our best catches occuring close to new and full moon. This is due to higher tide levels which allows more eels into our tidal marsh when it fills with water.
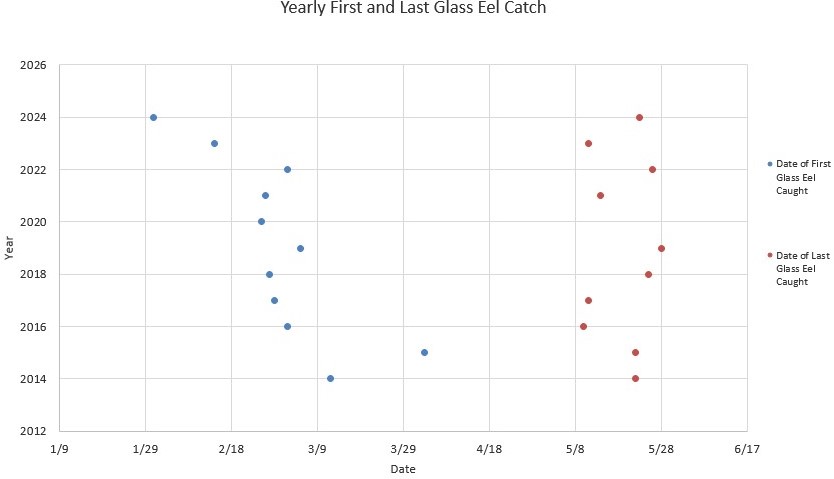
Our historical start and end dates for each season. While end dates have remained faily steady, there has been a notable trend towards earlier starts in recent years.
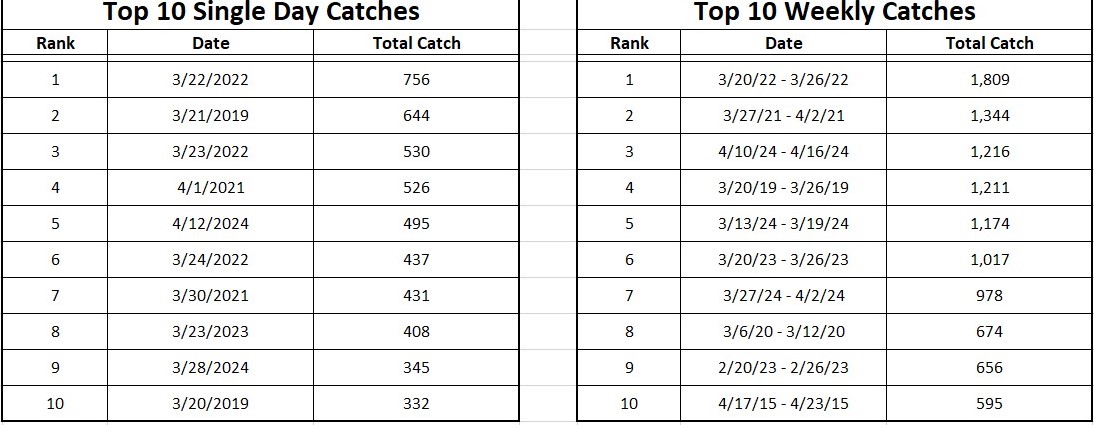
Our top 10 daily and weekly catches from our 11 years of sampling. Several dates from this season made the list.
So what does this eel data mean? Well one thing that we can easily see from our results is that eel counts have been increasing, especially over the last 5 years. This is great news! Why is it happening? There are many reasons why eel counts could be going up including increased awareness, tougher restrictions on illegal harvesting, etc. The big question is do eel counts continue to go up, or was this an outlier year? It will be interesting to see what happens next year.
Data from all 11 years of our sampling may be found on the eel page of our website.
Sampling would not have been possible without our dedicated team of eel volunteers including:
- 12 Sarah Lawrence College Students
- 10 Yonkers HS Students
- 8 Adult Volunteers
- 4 Staff
- Classes from Pace HS and Yonkers Montessori Academy
Thanks everyone for your help in making this season a success!