A Look Back at the Data: October & November Historical Seining Results
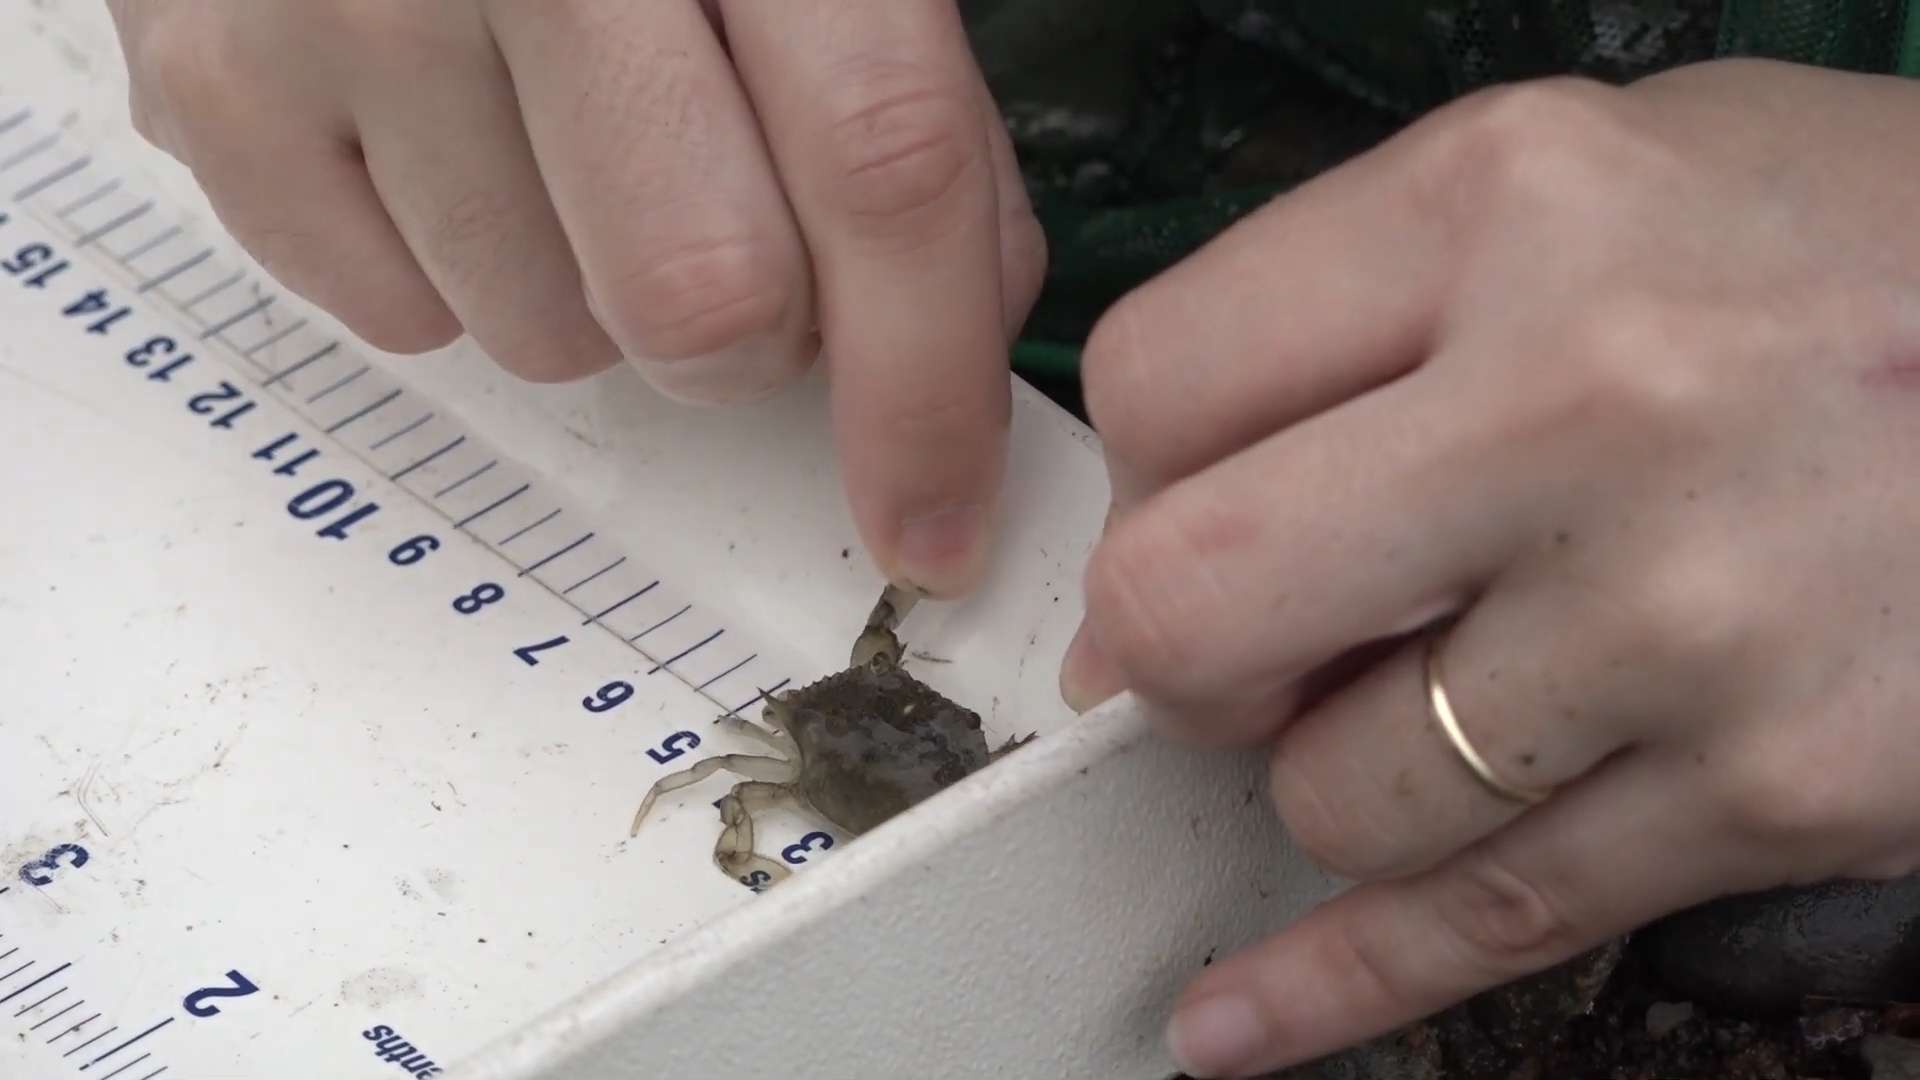
Pictured above - Measuring a blue crab caught while seining.
As CURB’s seining season continues to be on hold due to the COVID-19 pandemic, we take our monthly look back at our historical seining data. This summary will be focused on October and November data that was collected from 2005 – 2019.
CURB’s typical seining season runs from late April – early November, when conditions are warm enough to take our classes into the Hudson River. While the water begins to cool down in October, it usually remains somewhat warmer than the air temperature due to the lingering warmth left over from late summer and early fall. Since the Hudson is such a large body of water, it takes some time for it to catch up to the cooler air temperature. Therefore even though the air is cooling, we still see some abundant catches during the month of October. In fact, looking at the data below, October has the highest average catch per program out of any of our 8 months of seining.
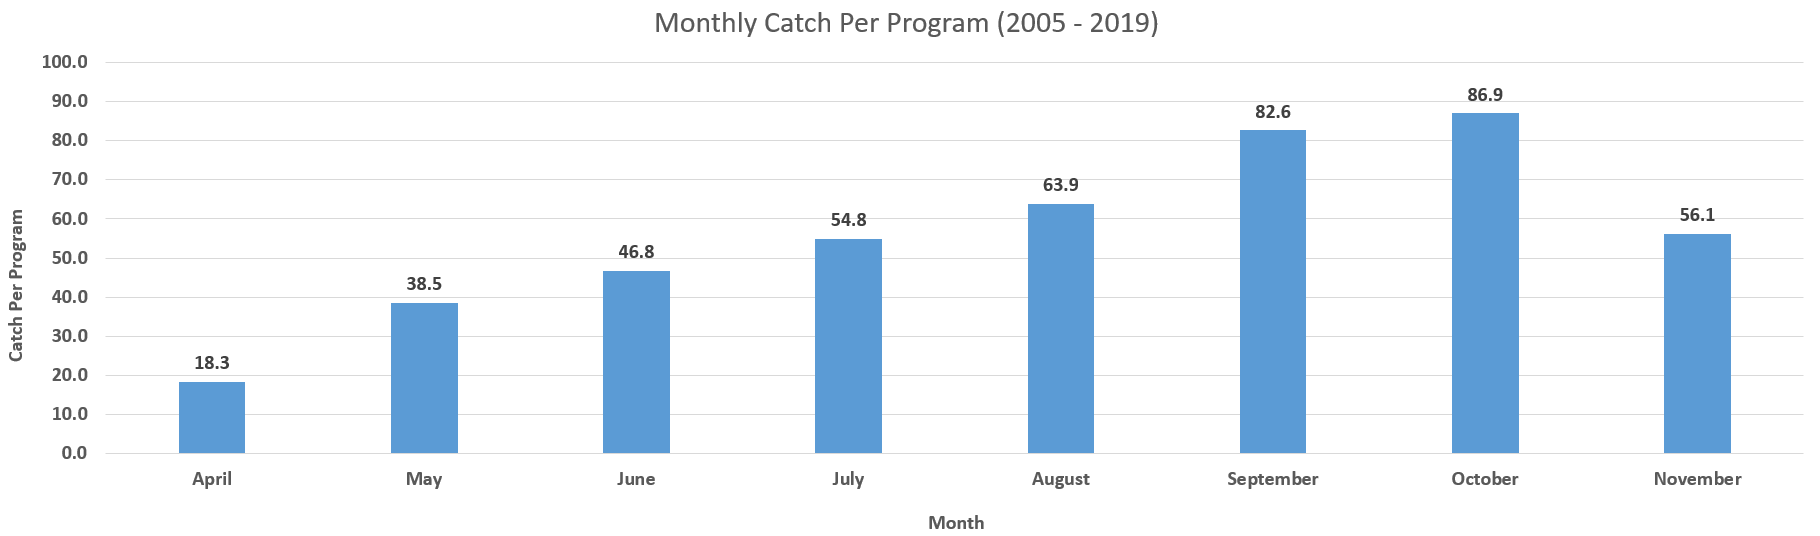
September and October are our 2 months for peak catches, with averages of over 80 organisms caught per program. This drops off once we get into November, as the water finally begins to cool more quickly. It should also be noted that our November catch is a much smaller sample size since programs usually wrap up during the first week of the month.
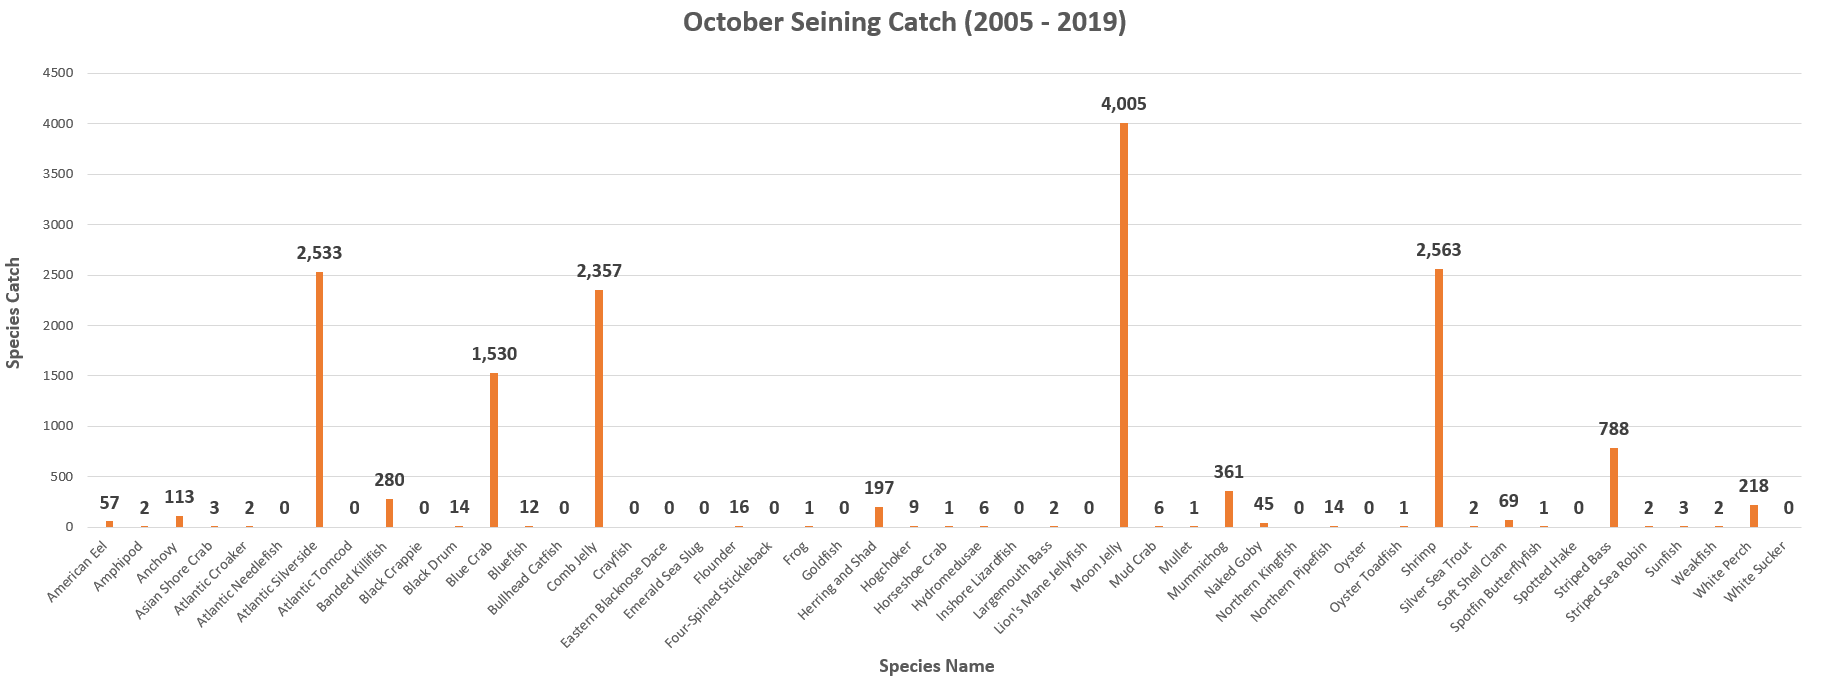
October has also produced some of our most diverse catches, with over 40 different species of organisms caught. Some of the less common for our area catches include Atlantic croaker, black drum, silver sea trout, spotfin butterflyfish, and weakfish. See the graph below for a full list of our October catches.
21.5% of our overall catch occurs during October, which is the highest percentage for any month. 45.2% of all comb jellies and 35.7% of moon jellies are caught during October. Other species with high percentages include (minimum of 20 caught): herring and shad 20.9%, naked goby 20.7%, Atlantic silverside 19.8%, striped bass 18.7%, and shrimp 18.6%.
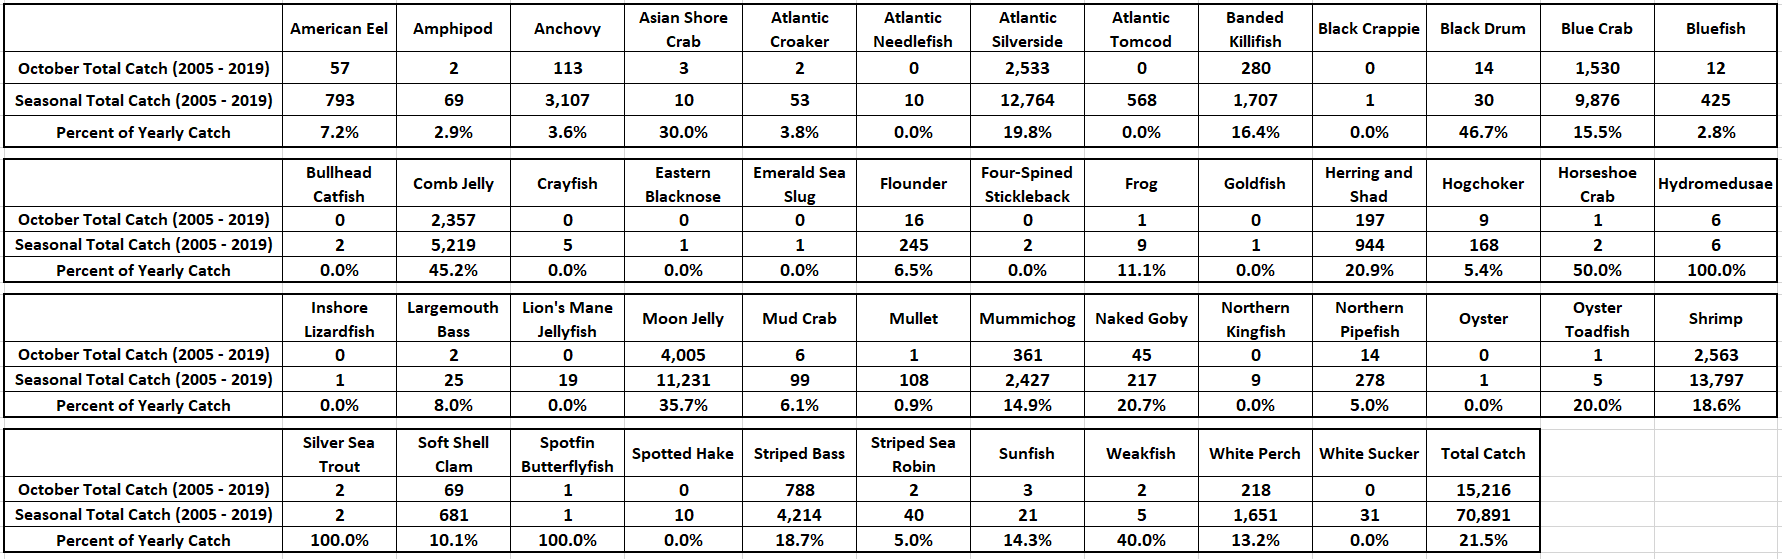
The table below shows the October catch total for each of our 15 years of seining data, along with the percentage of the total seasonal catch.
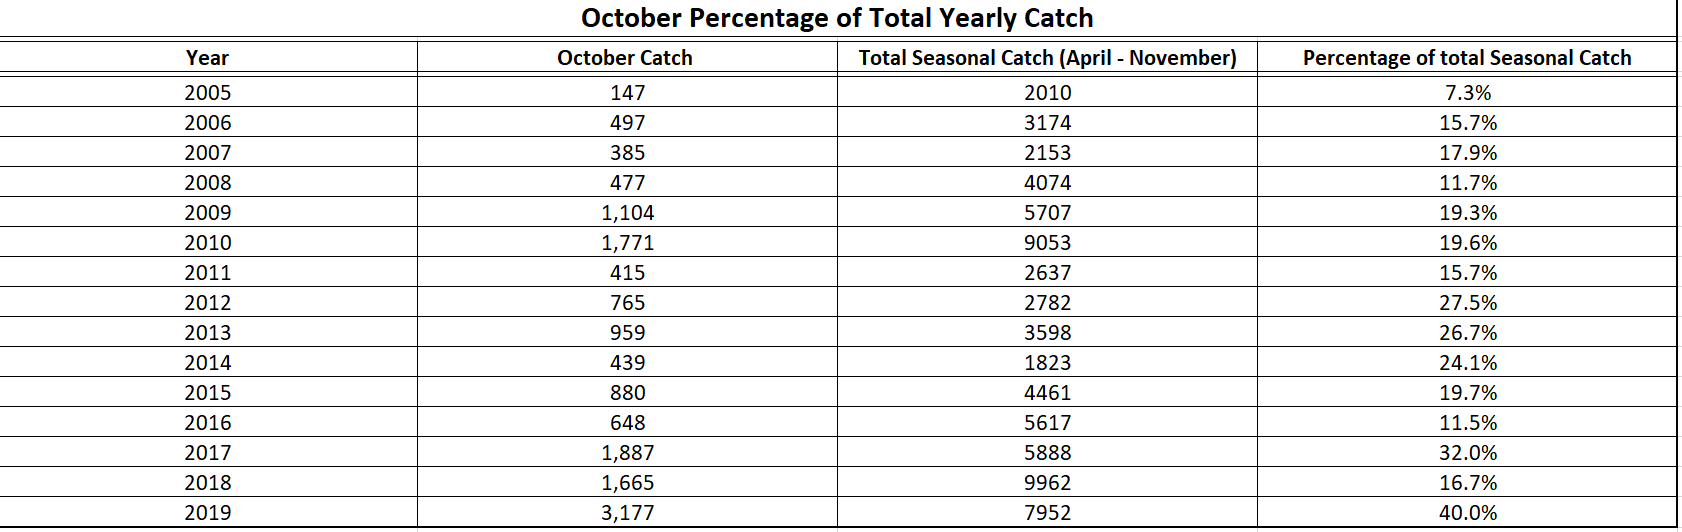
In recent years we have seen a tendency for high catch totals late in the season. If we break this table down a bit further, from 2005 – 2011 on average 15.3% of our catch occurred in October. However from 2012 – 2019 this yearly average rose to 24.8%.
Lastly, just taking a quick look at our catch totals for November shows three species standing out from the rest: striped bass at 110 caught, moon jelly 106, and Atlantic silverside 103.
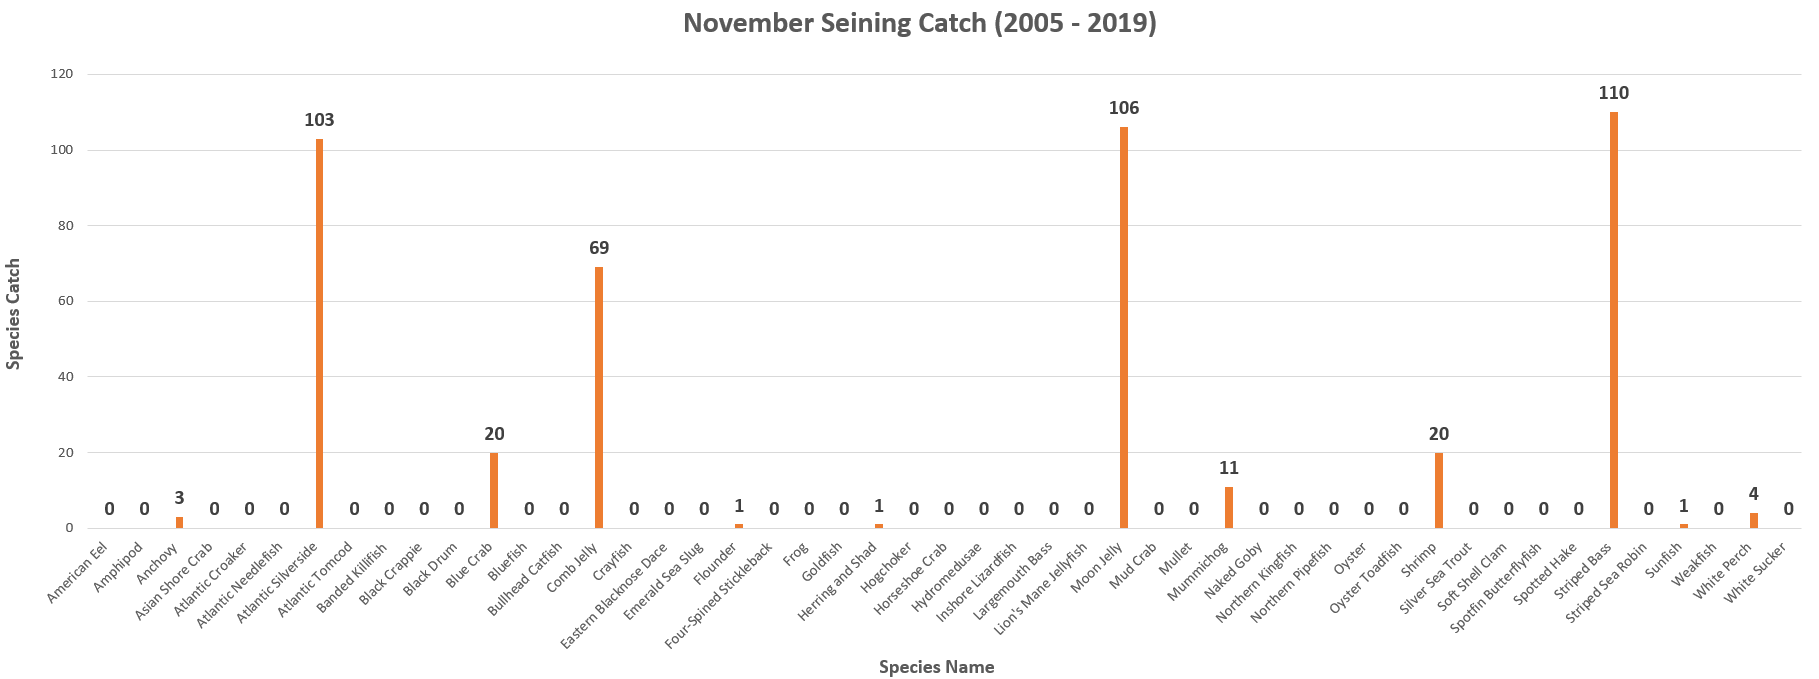
You'll also notice that these numbers are much lower than our totals for October. In addition to colder water conditions, we have hosted just 8 programs during the month of November, as opposed to 175 in October. But you can still get a good sense of what is caught near the end of our seining season.
For a full look at our fish counts, please check out the seining page of our website.