A Look Back at the Data: June Historical Seining Results
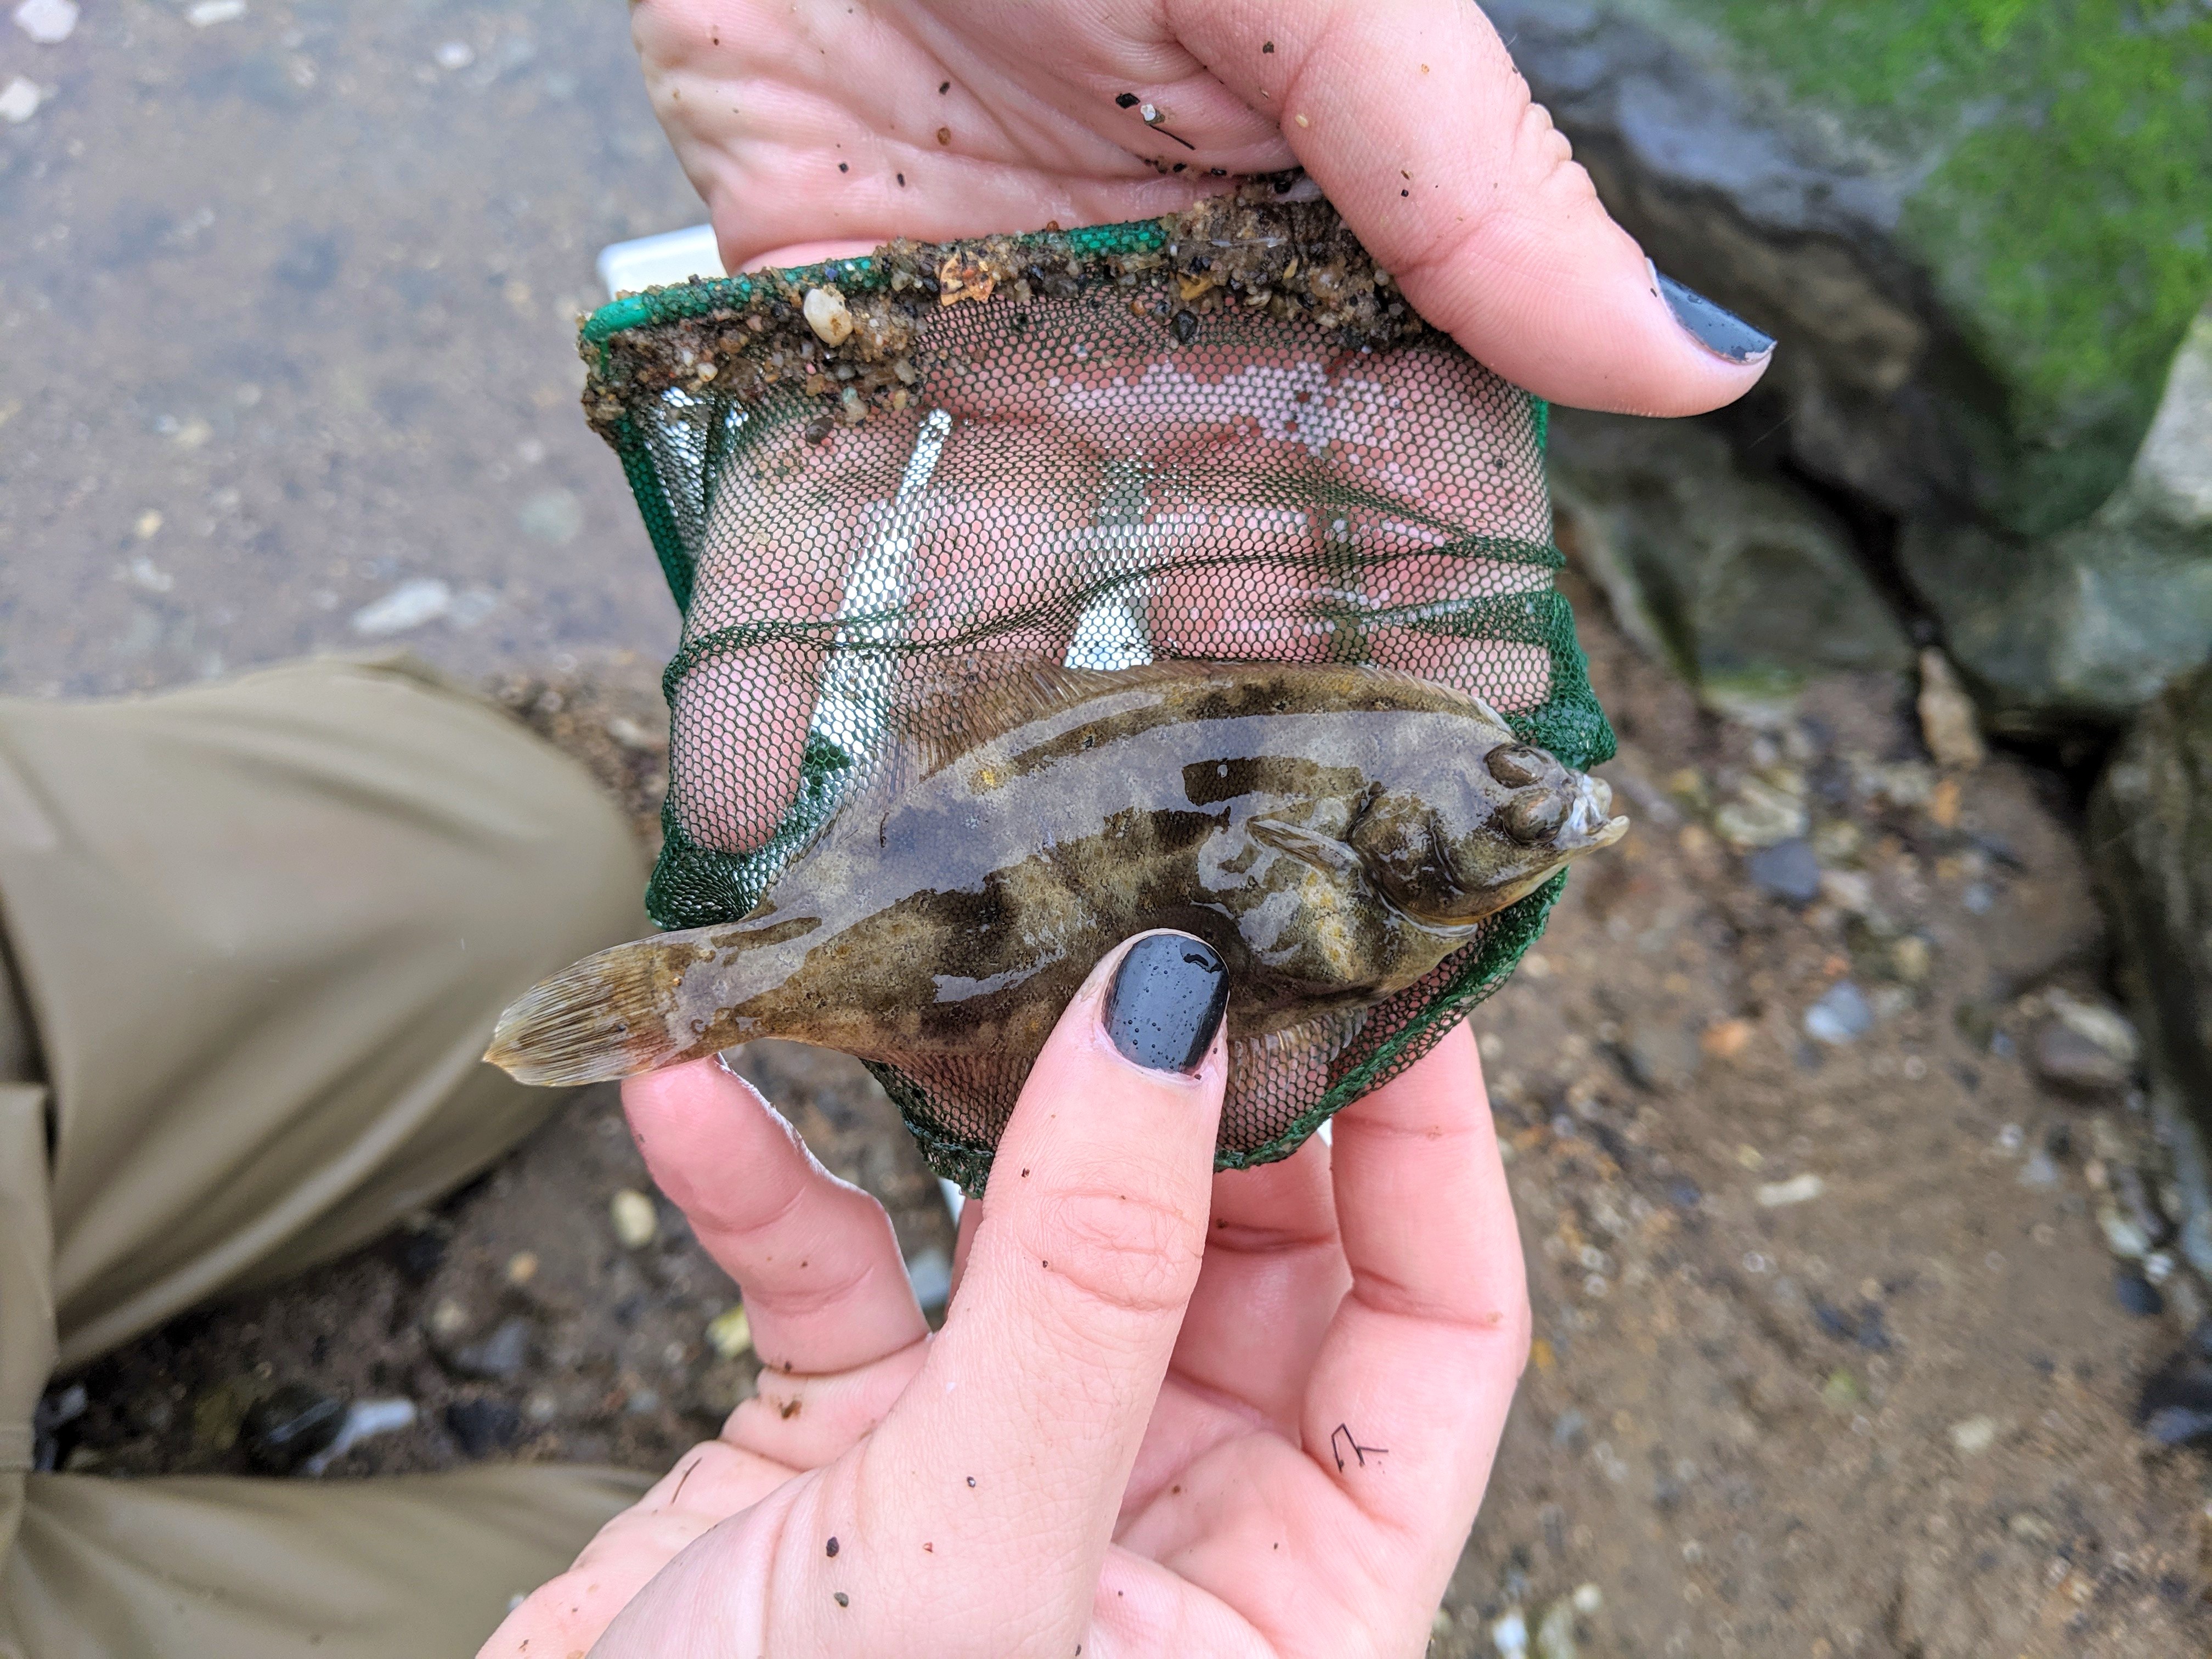
Pictured above - A winter flounder caught during one of our seining education programs.
As CURB’s seining season continues to be on hold due to the COVID-19 pandemic, we take our monthly look back at our historical seining data. This summary will be focused on June data that was collected from 2005 – 2019.
While our typical seining season starts in the second half of April, it’s not until June that we begin to see large increases in what is caught along our shoreline. This is mainly due to the water temperature. Throughout much of April and May, the water temperature hovers in the 50’s and 60’s, which is still a bit cold for the fish and crustaceans that we see in the area. However, once we get into June, the water rises up into the 70’s which is much more habitable for the fish. Not surprisingly, we begin to see a much more diverse catch, along with higher totals during our programs.
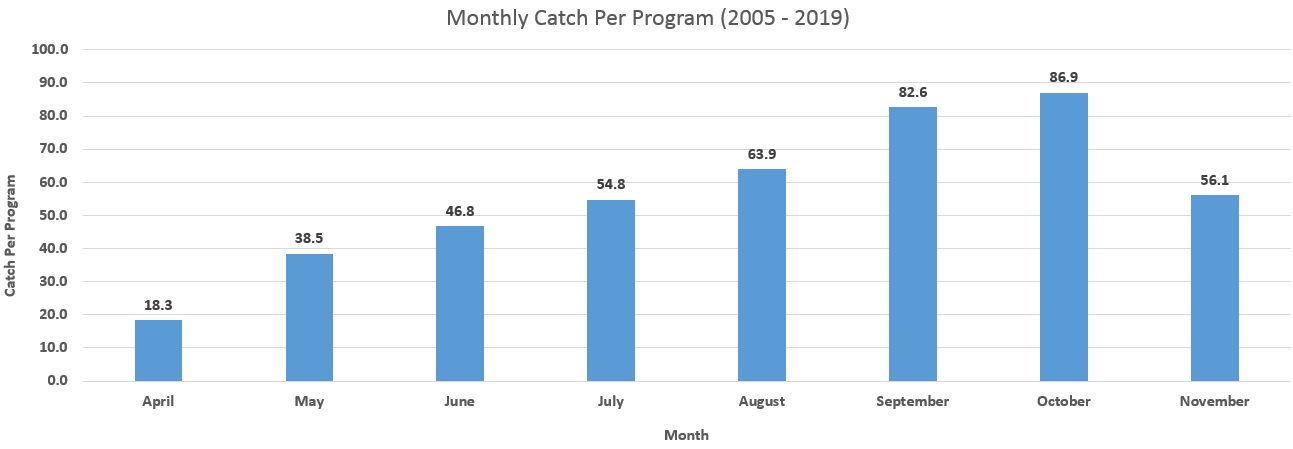
The chart above shows our monthly catch per program average during our seasonal seining programs. You can see that there is a steady increase in totals starting from April and continuing through October, before dropping off in November. This corresponds with rising water temperatures throughout the summer.
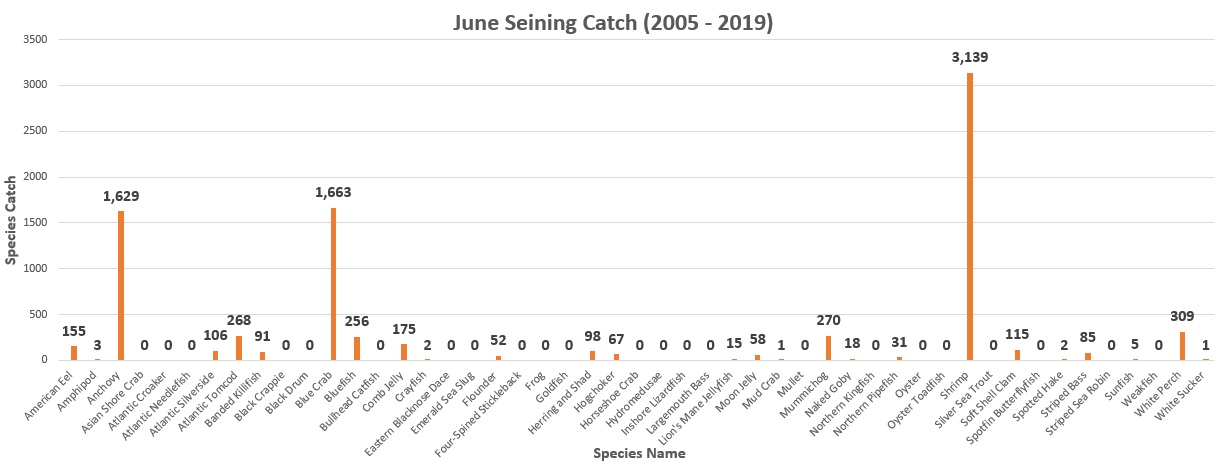
In terms of what is being caught during June, 3 animals stand out on the above graph: shrimp (sand and grass), blue crabs, and anchovies. We typically catch large numbers of crabs and shrimp throughout the season, but anchovies tend to be more of an early season catch. If we looked at the summer and fall months, you would see much lower counts of anchovies. Other prominent June catches include white perch, mummichogs, Atlantic tomcods, and bluefish. In the table below, you can see that the majority of anchovies (52.4%) and bluefish (60.2%) are caught in June.
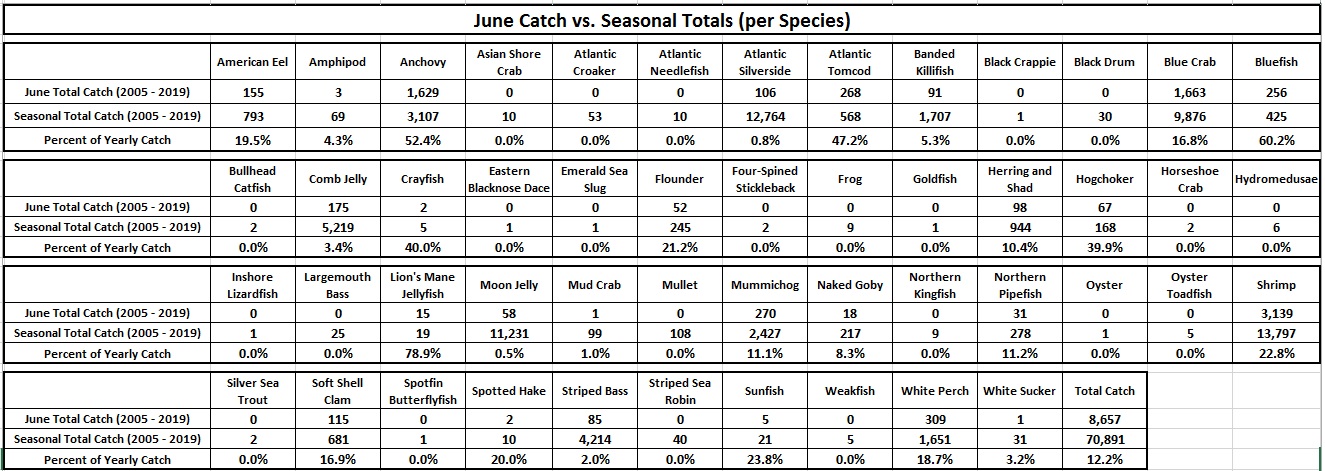
Other species with relatively high numbers during June include Atlantic tomcods (47.2%), hogchokers (39.9%), and lion’s mane jellyfish (78.9%).
Lastly, let’s take a look at the trends in our June catches over the last 15 years. The table below shows the catch total for June in each of the last 15 years, along with the catch per program average during these months.
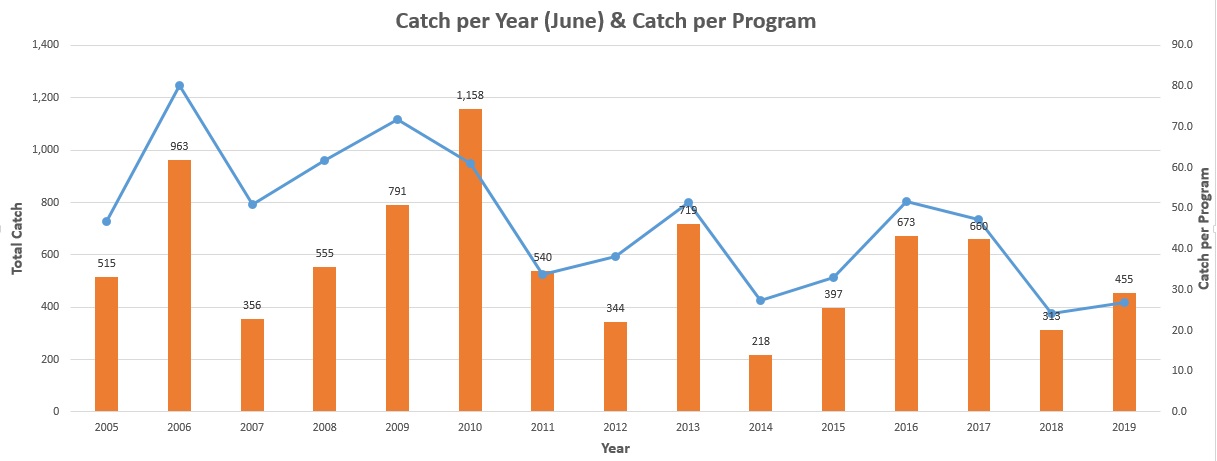
One thing you will notice is a general slow downtrend in these numbers. The changes aren’t huge, but there is a slight decrease over the 15 years. It’s hard to say what this actually means since our overall seasonal catches have been steady. But for whatever reason the peak of the season has been getting a bit of a later start in recent years. This can also be seen in the table below, which shows the June percentage of total yearly catch.
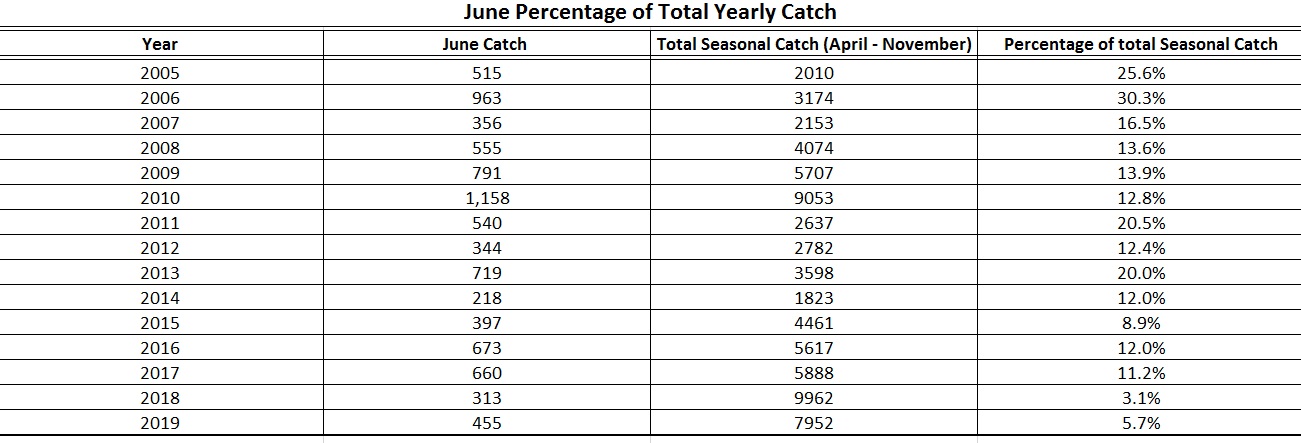
In 3 of the last 5 years (2015 – 2019), June made up less than 10 percent of the overall seasonal catch. It should be noted though that in terms of total seasonal catch, those 5 years ranked 7th, 6th, 4th, 1st and 3rd. So the lower June catches don’t necessarily correspond to reduced catches over a complete season.
For a full look at the data, please check out the seining page of our website.